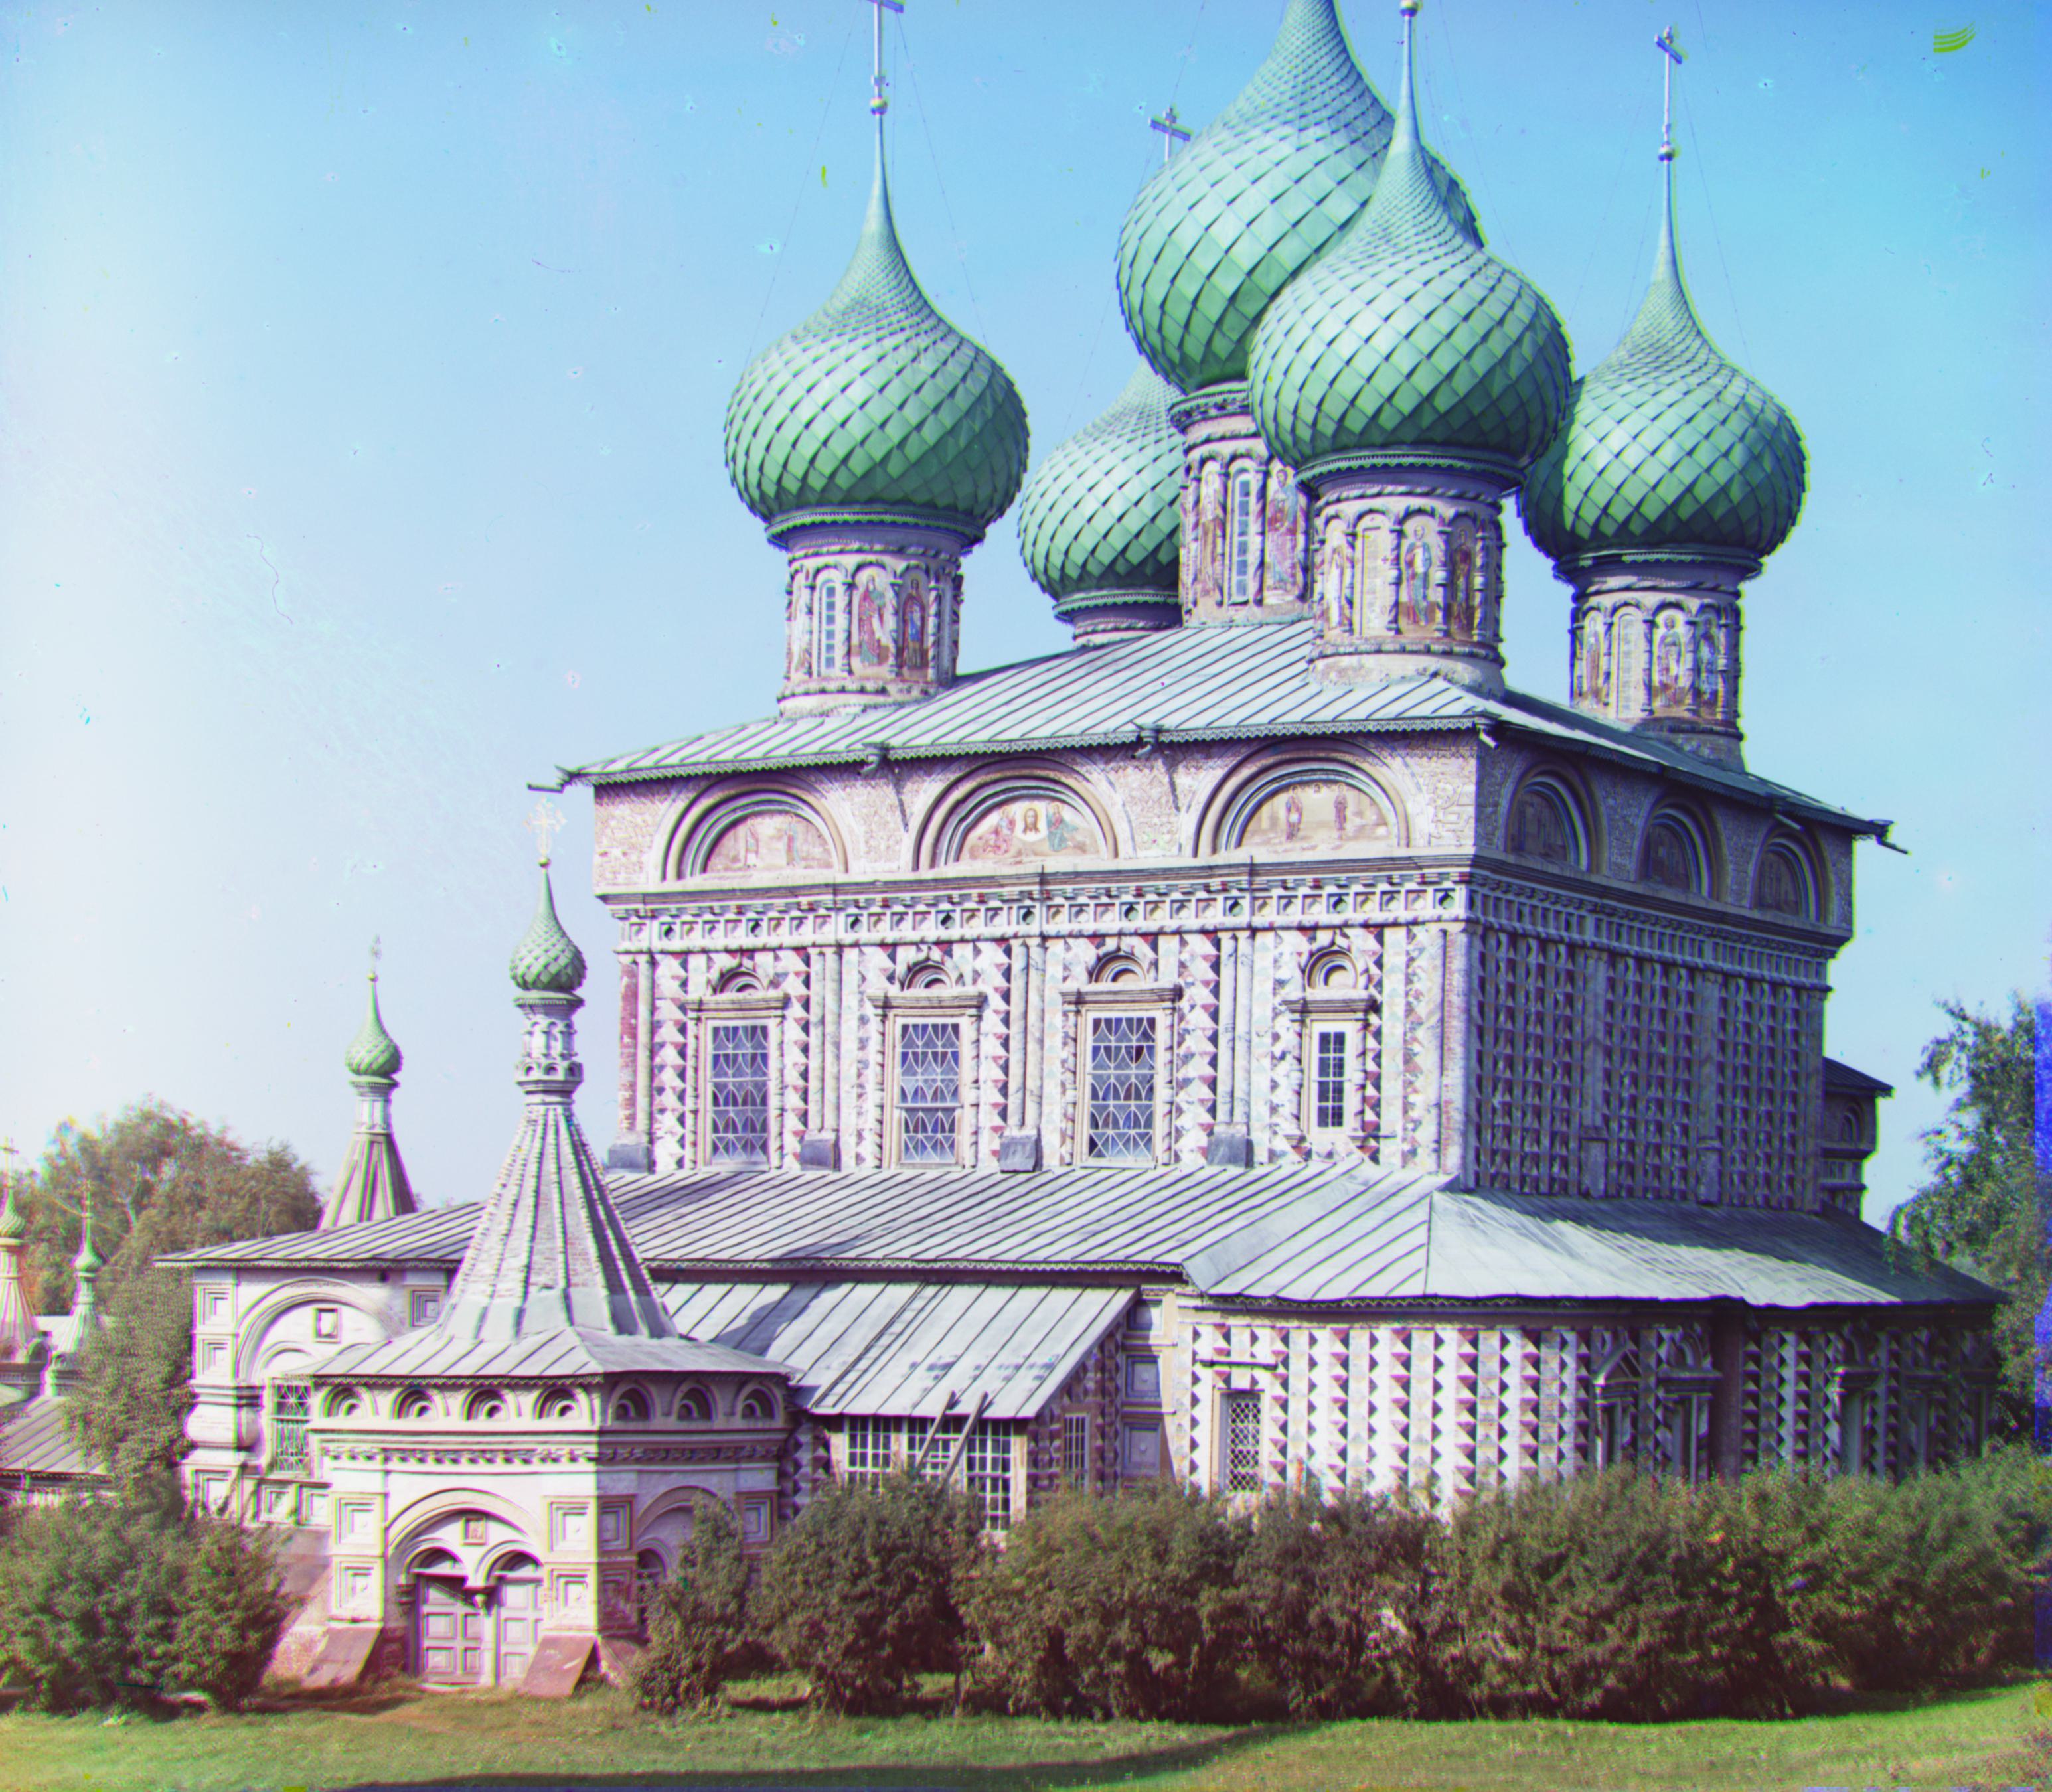
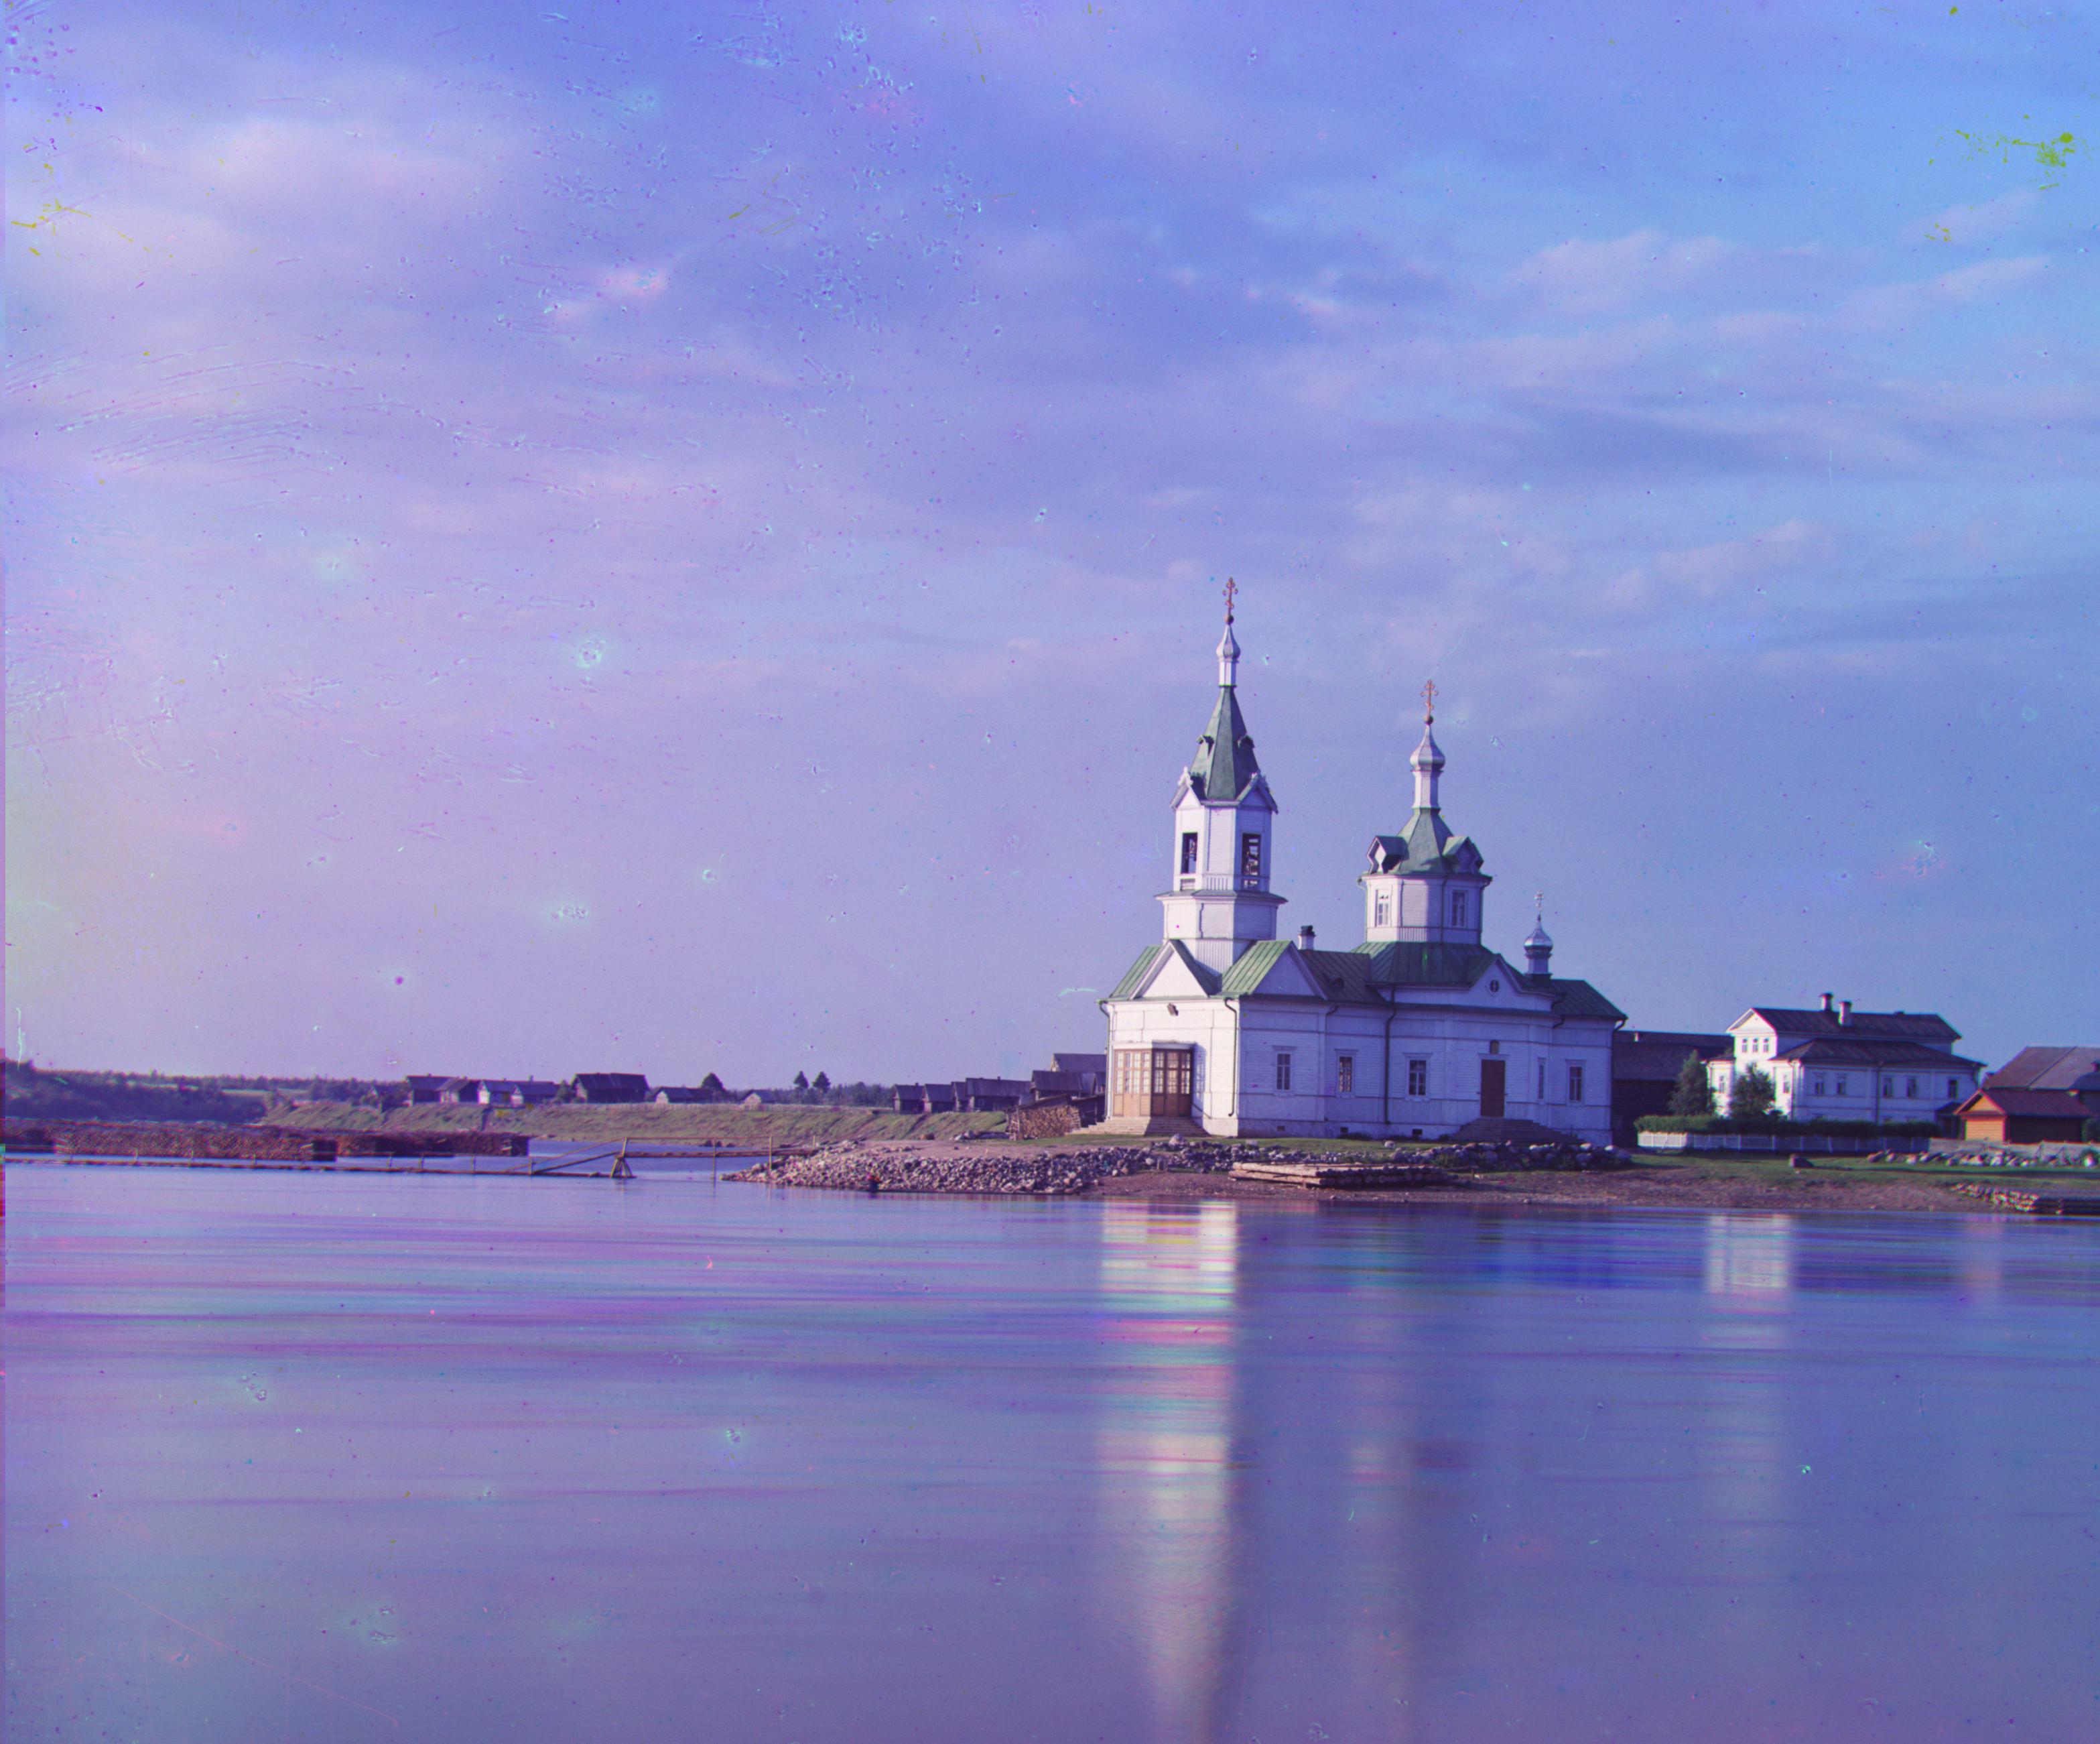
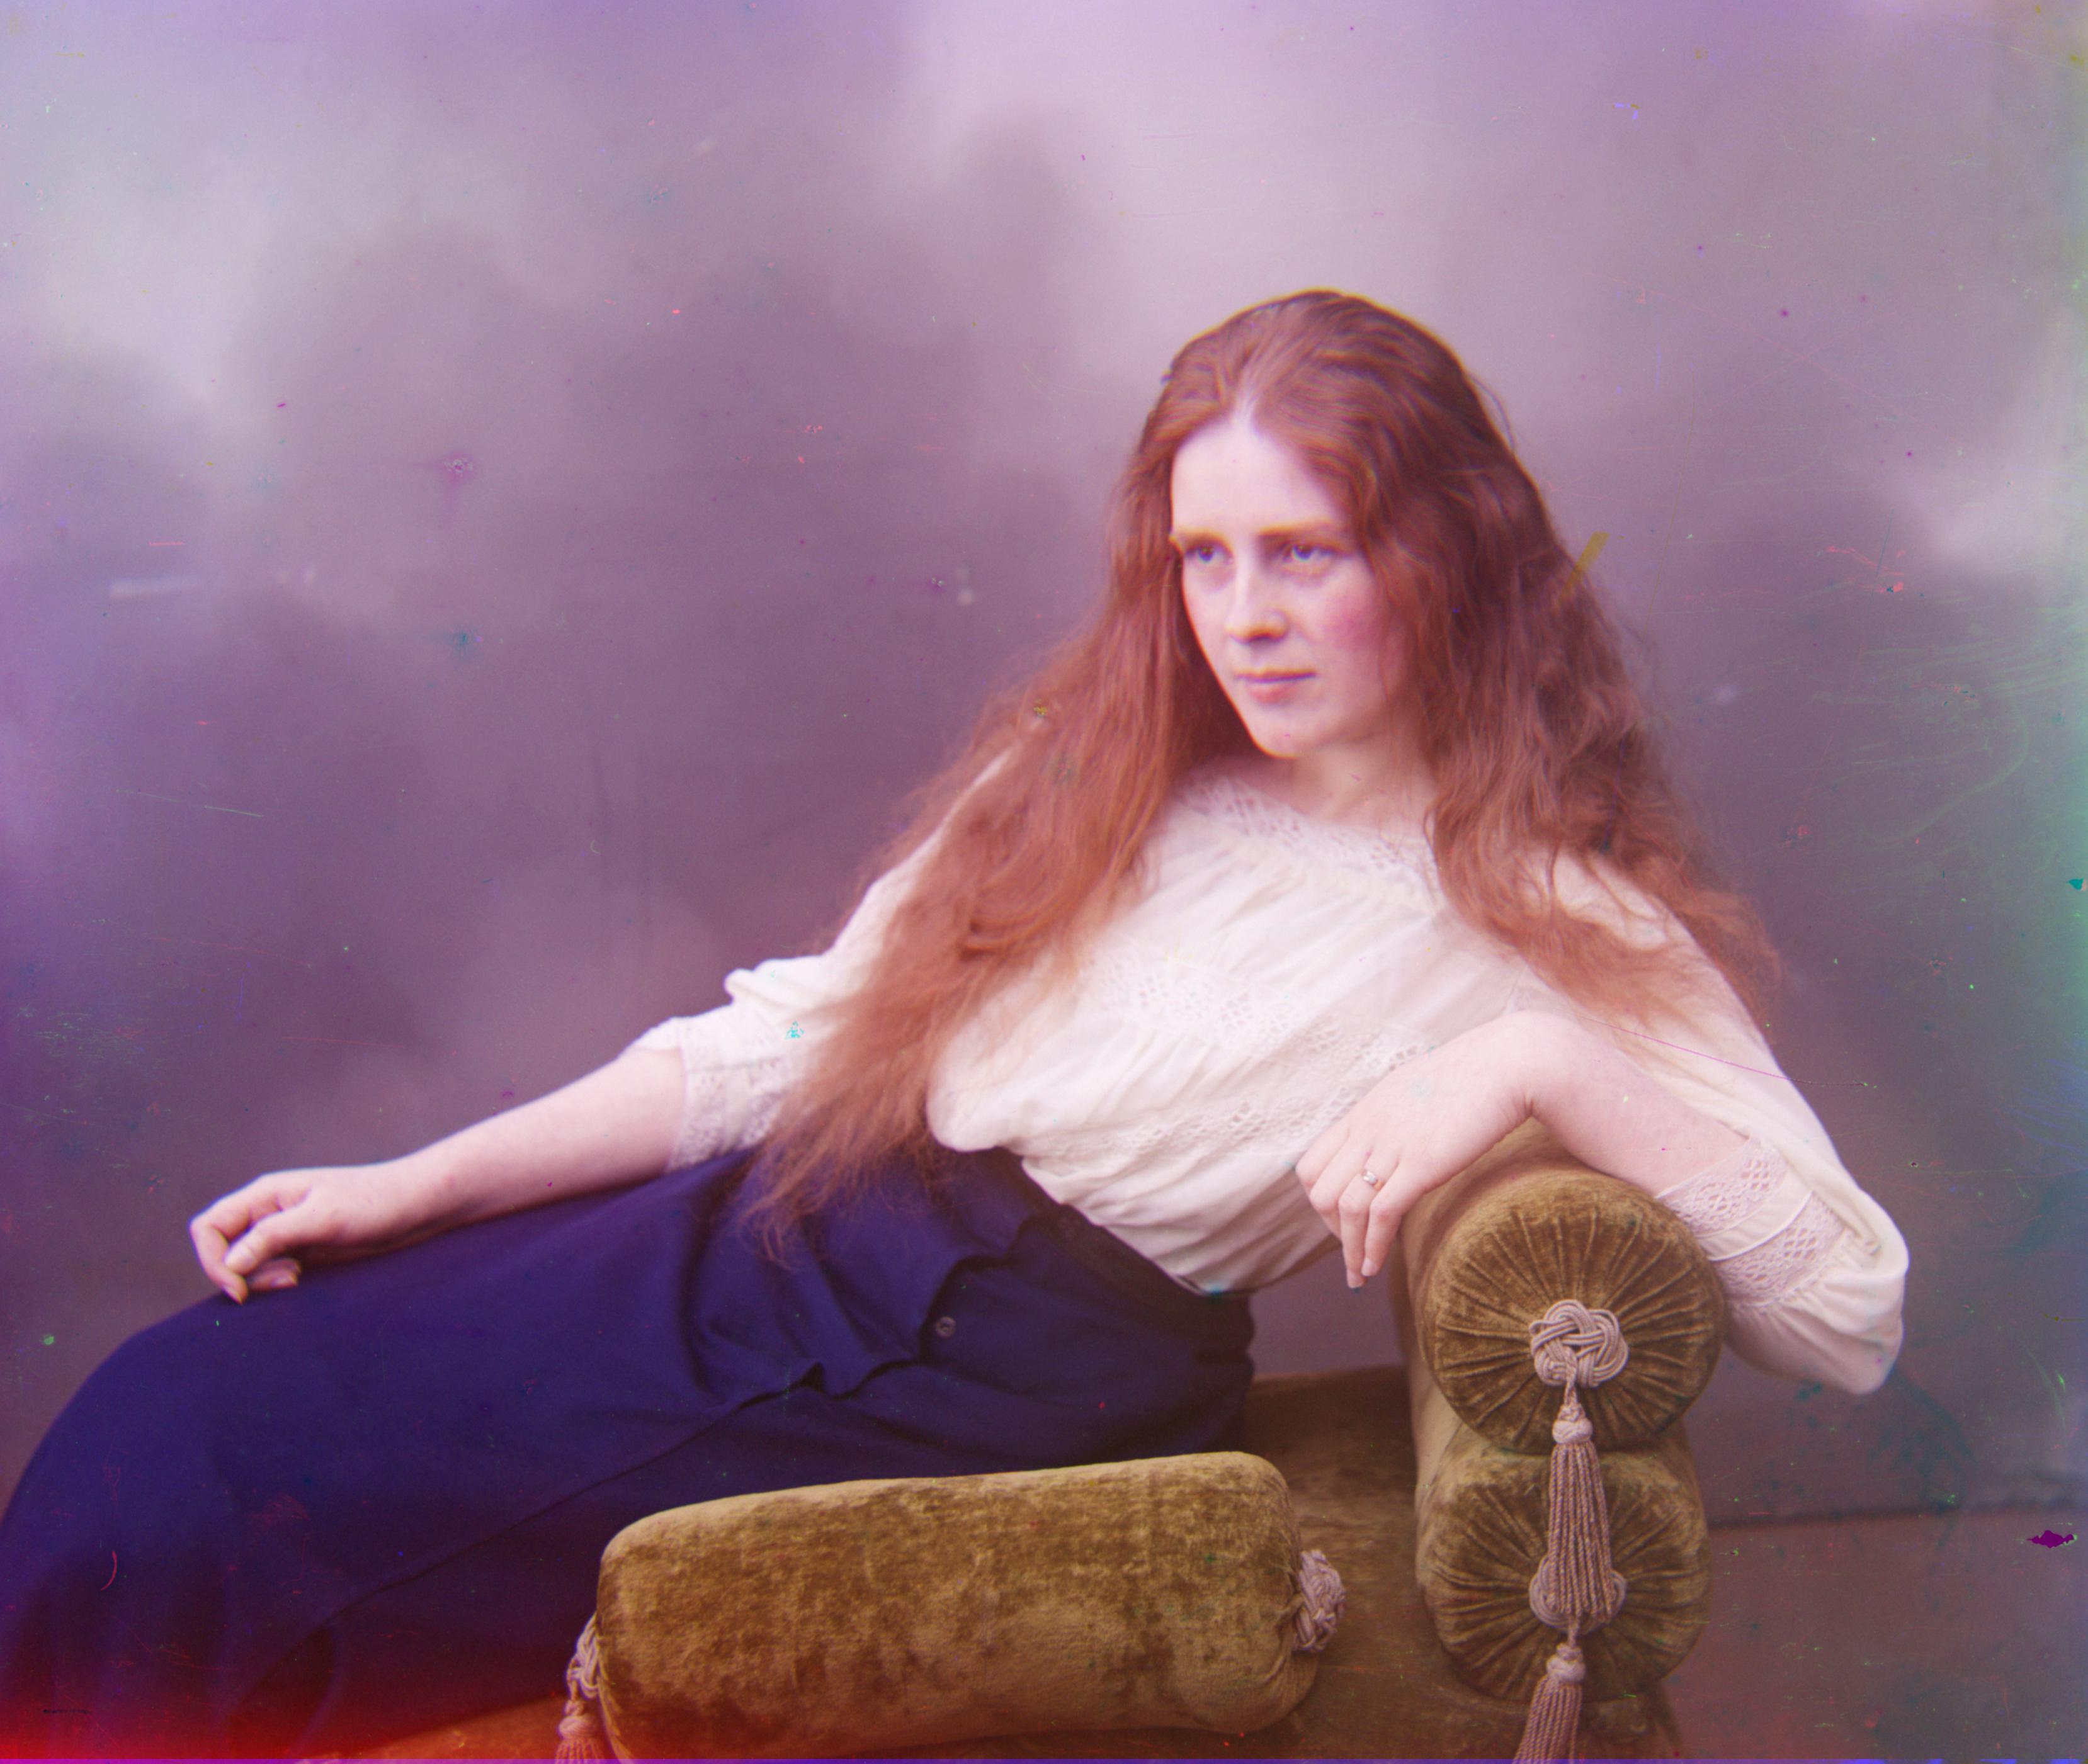
Sergei Mikhailovich Prokudin-Gorskii (1863-1944) [Сергей Михайлович Прокудин-Горский, to his Russian friends] was a man well ahead of his time. Starting in 1907, Prokudin-Gorskii embarked on a great journey throughout the Russian Empire, taking many photos of almost anything he came accross. As a true visionary, he predicted color photography as the upcoming technological advancement; while he made a correct prediction that color images would be represented using red, green, and blue channels in the future, his way of capturing them differs from how we do today. He took three single color images or a target with red, blue, and green filters in front of the camera. These images provide a fantastic glimpse into the colorized past of Russia ... if they can be seen. Most of his images--now digitized by the Library of Congress--suffer from poor alignment across the color channels and other imperfections. Thus, this project aims to restore the images and fix such alignment issues to create beautiful images from the Prokudin-Gorskii color negatives.
The goal of this assignment is to take the digitized Prokudin-Gorskii glass plate images and, using image processing techniques, automatically produce a color image with as few
visual artifacts as possible.
After experimenting in a notebook to determine what techniques were effective, I created a python script image pipeline to load in the Prokudin-Gorskii images from .jpg and .tif files in the /data folder and output alinged RGB images.
My initial step is to load in the images, coerce the datatype to uint8 (for .tif images) (in order to save memory when computing and have consistency in datatypes between images), and split the image into RGB channels.
Next, I manually trim the borders of the images before aligning in order to improve the information content of the image channels since the borders largely contain nonsense that is counterproductive to centering. I created a useful function to make this task less labourious: It first displays the image with axes showing overall image size and where features lie in the image; then I can enter the best offsets for each edge of the image--which are then applied to the image.
Now, the image is ready for the centering process. As a note, I use my image pyramid for centering all images. To create the each level in the image pyramid, I apply a Guassian blur to the preceding image in the level below of the pyramid and reduce the length of each axis by 0.5 by selecting every other row and column. Using my chosen scoring metric, I begin alignment with the smallest image in the pyramid, searching a [-15, 15] pixel range in both dimensions to find the best match between the channels. I then use the optimal centering result just found as a starting point to center the next image down in the pyramid. I continue this pattern until the bottom of the pyramid.
I tried many different metrics to determine the optimal alignment. I intially tried SSD; however, it did not produce good results. I also tried using the mean value of un-normalized pixels of the correlated image channels due to rounding problems with my early NCC implementations. This worked better than expected, but not as well as NCC. I next tried Normalized Cross Correlation (NCC), which I found to work well across all images when coupled with the correct featurization (detailed in bells and whistles). I also tried using a structural similarity score to align images. This worked well, but did not offer any noticable improvement over NCC while being computationally more expensive. Thus, I chose NCC to be the metric to use for alignment.
Curiously, I found that the technique used to shift the images matters greatly for getting good results. I initially used a complicated slicing pattern to align the channels that produced only the section of each channel that overlapped when the channels are shifted. This led to a lot of difficulty when actually wanting to take the found shift amounts and calculate the overlapping image. This method also did not scale well to my more advanced implementations, where I scan a [-15, 15] pixel range for each channel (G and B) with each channel having its own starting shift to begin searching from due to the results of the last level of the image pyramid. Most importantly, this method produced mediocre image alignment. I think that this is due to the following reason: when finding the NCC of each particular shift in the search range, the resulting image would be of a different size than for other shifts due to some pixels being cut out. Thus, I had to renormalize each shift, which was slow and did not seem to produce good results.
A much better and simpler method:
Ultimately, I decided to use np.roll, since it was reccomended by course staff. I intially doubted that this method would work well since it moved pixels to the other side of the image, where they were effectively non-sense. However, I found that this method provided much better results and was much simpler to implement (especially to implement the shifting once the optimal amount has been found)!
Now that the alignment step is finished, I simply roll the images using the optimal shifts found by my algorithm. Since this does result in some borders due to pixels being moved to the opposite side of the image from where their meaning lies, I also do small manual crops at this step as well. I use the same method as described above.
Now, it is time to save our produced image! I also save the amount I shifted each image by and how much I cropped each image by before and after shifting to a pandas dataframe. This makes my images completely reproducible to course staff. I made some nice functionality for this as well. More info will be described elsewhere on this page and in the README.txt file for how to use this to reproduce my images.


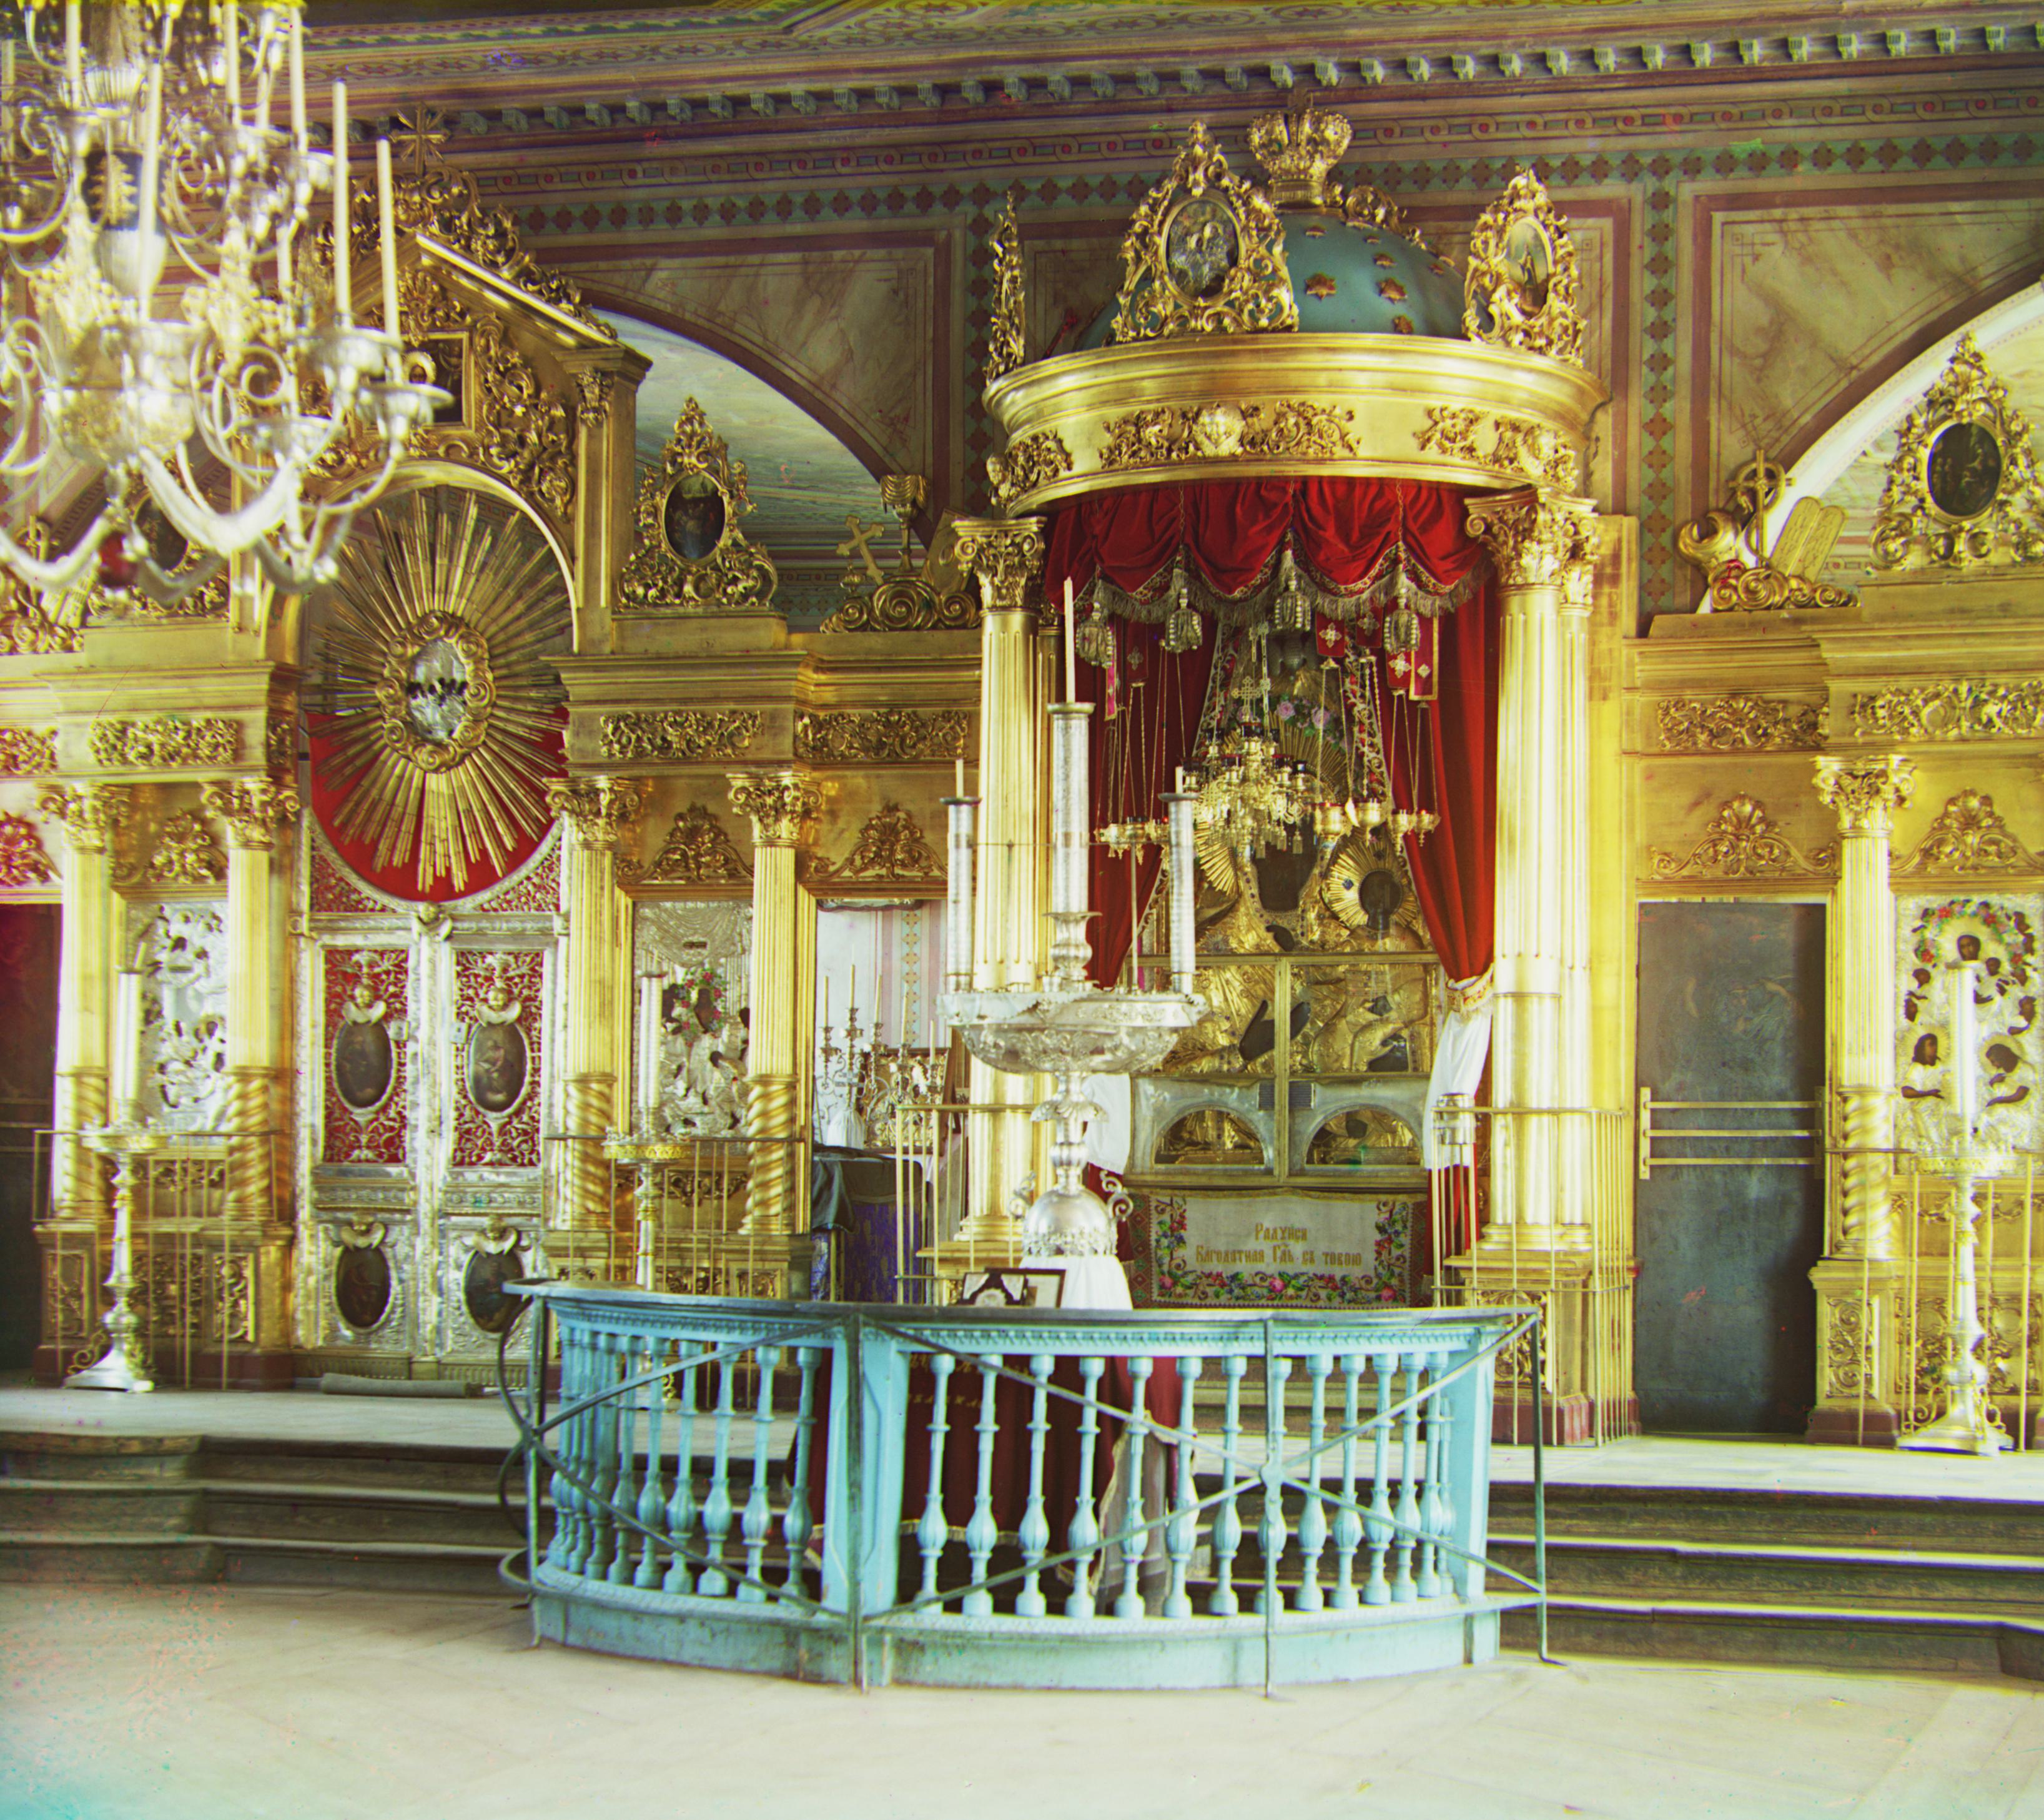
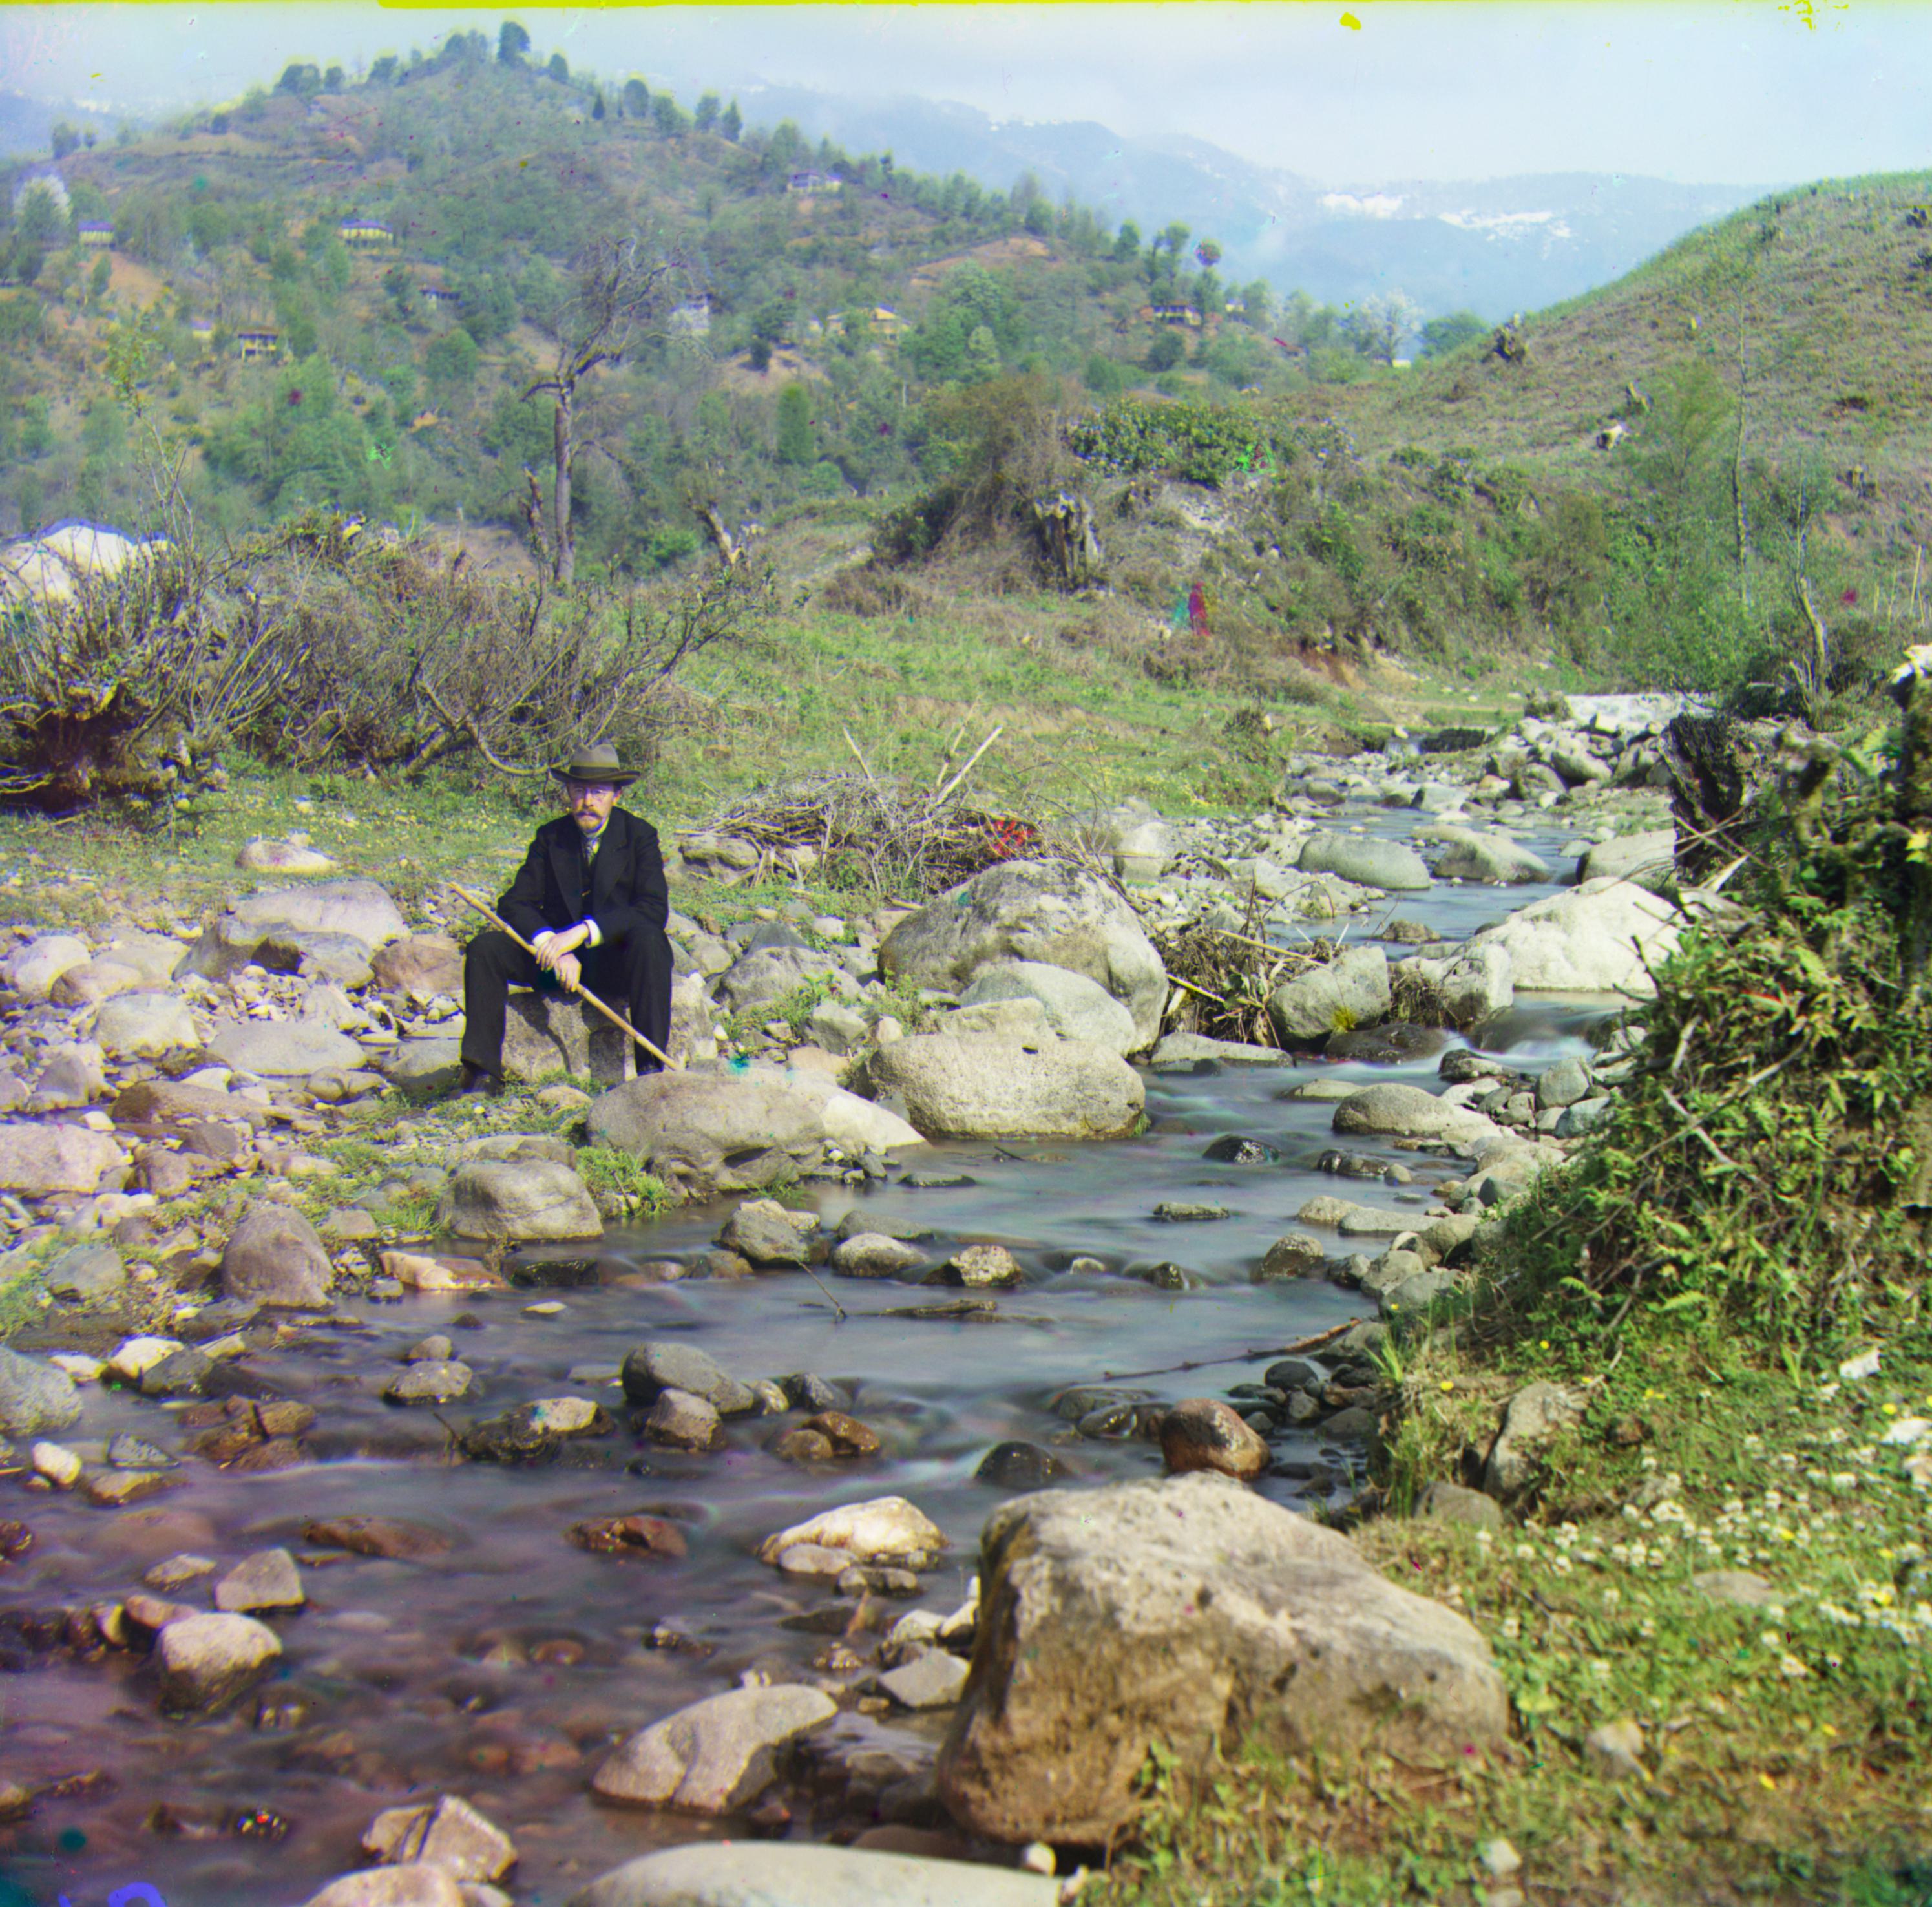
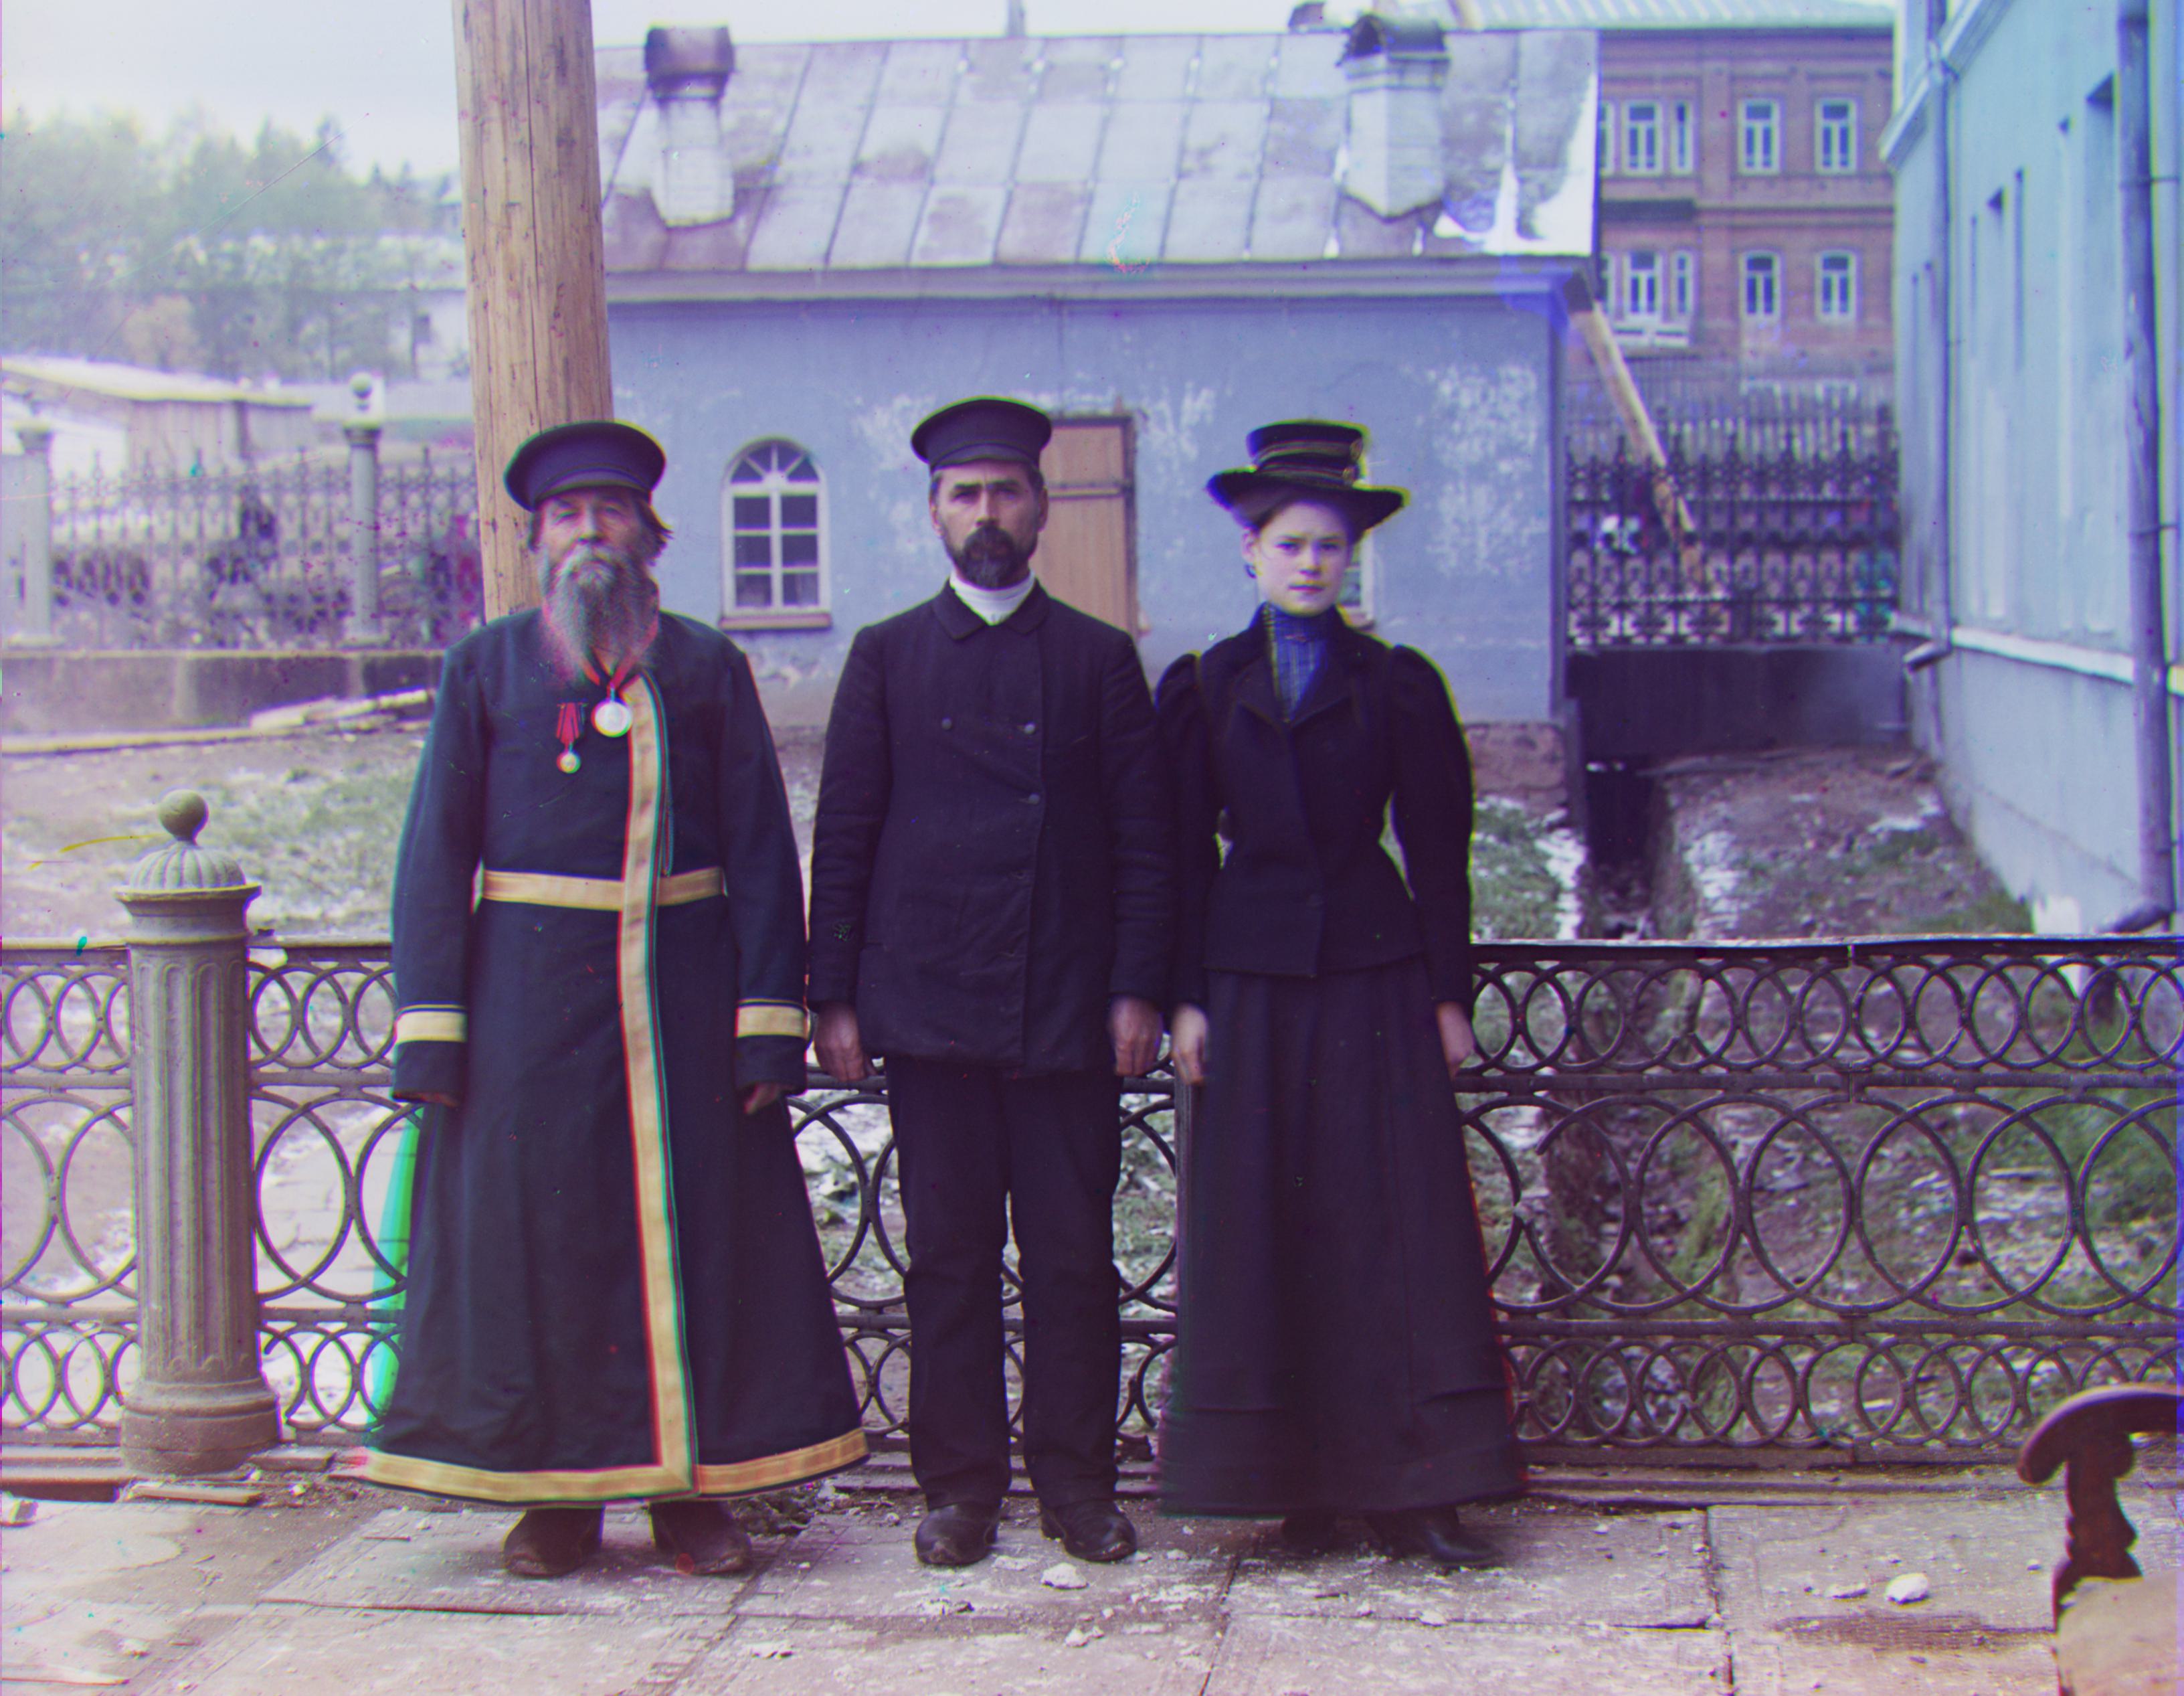
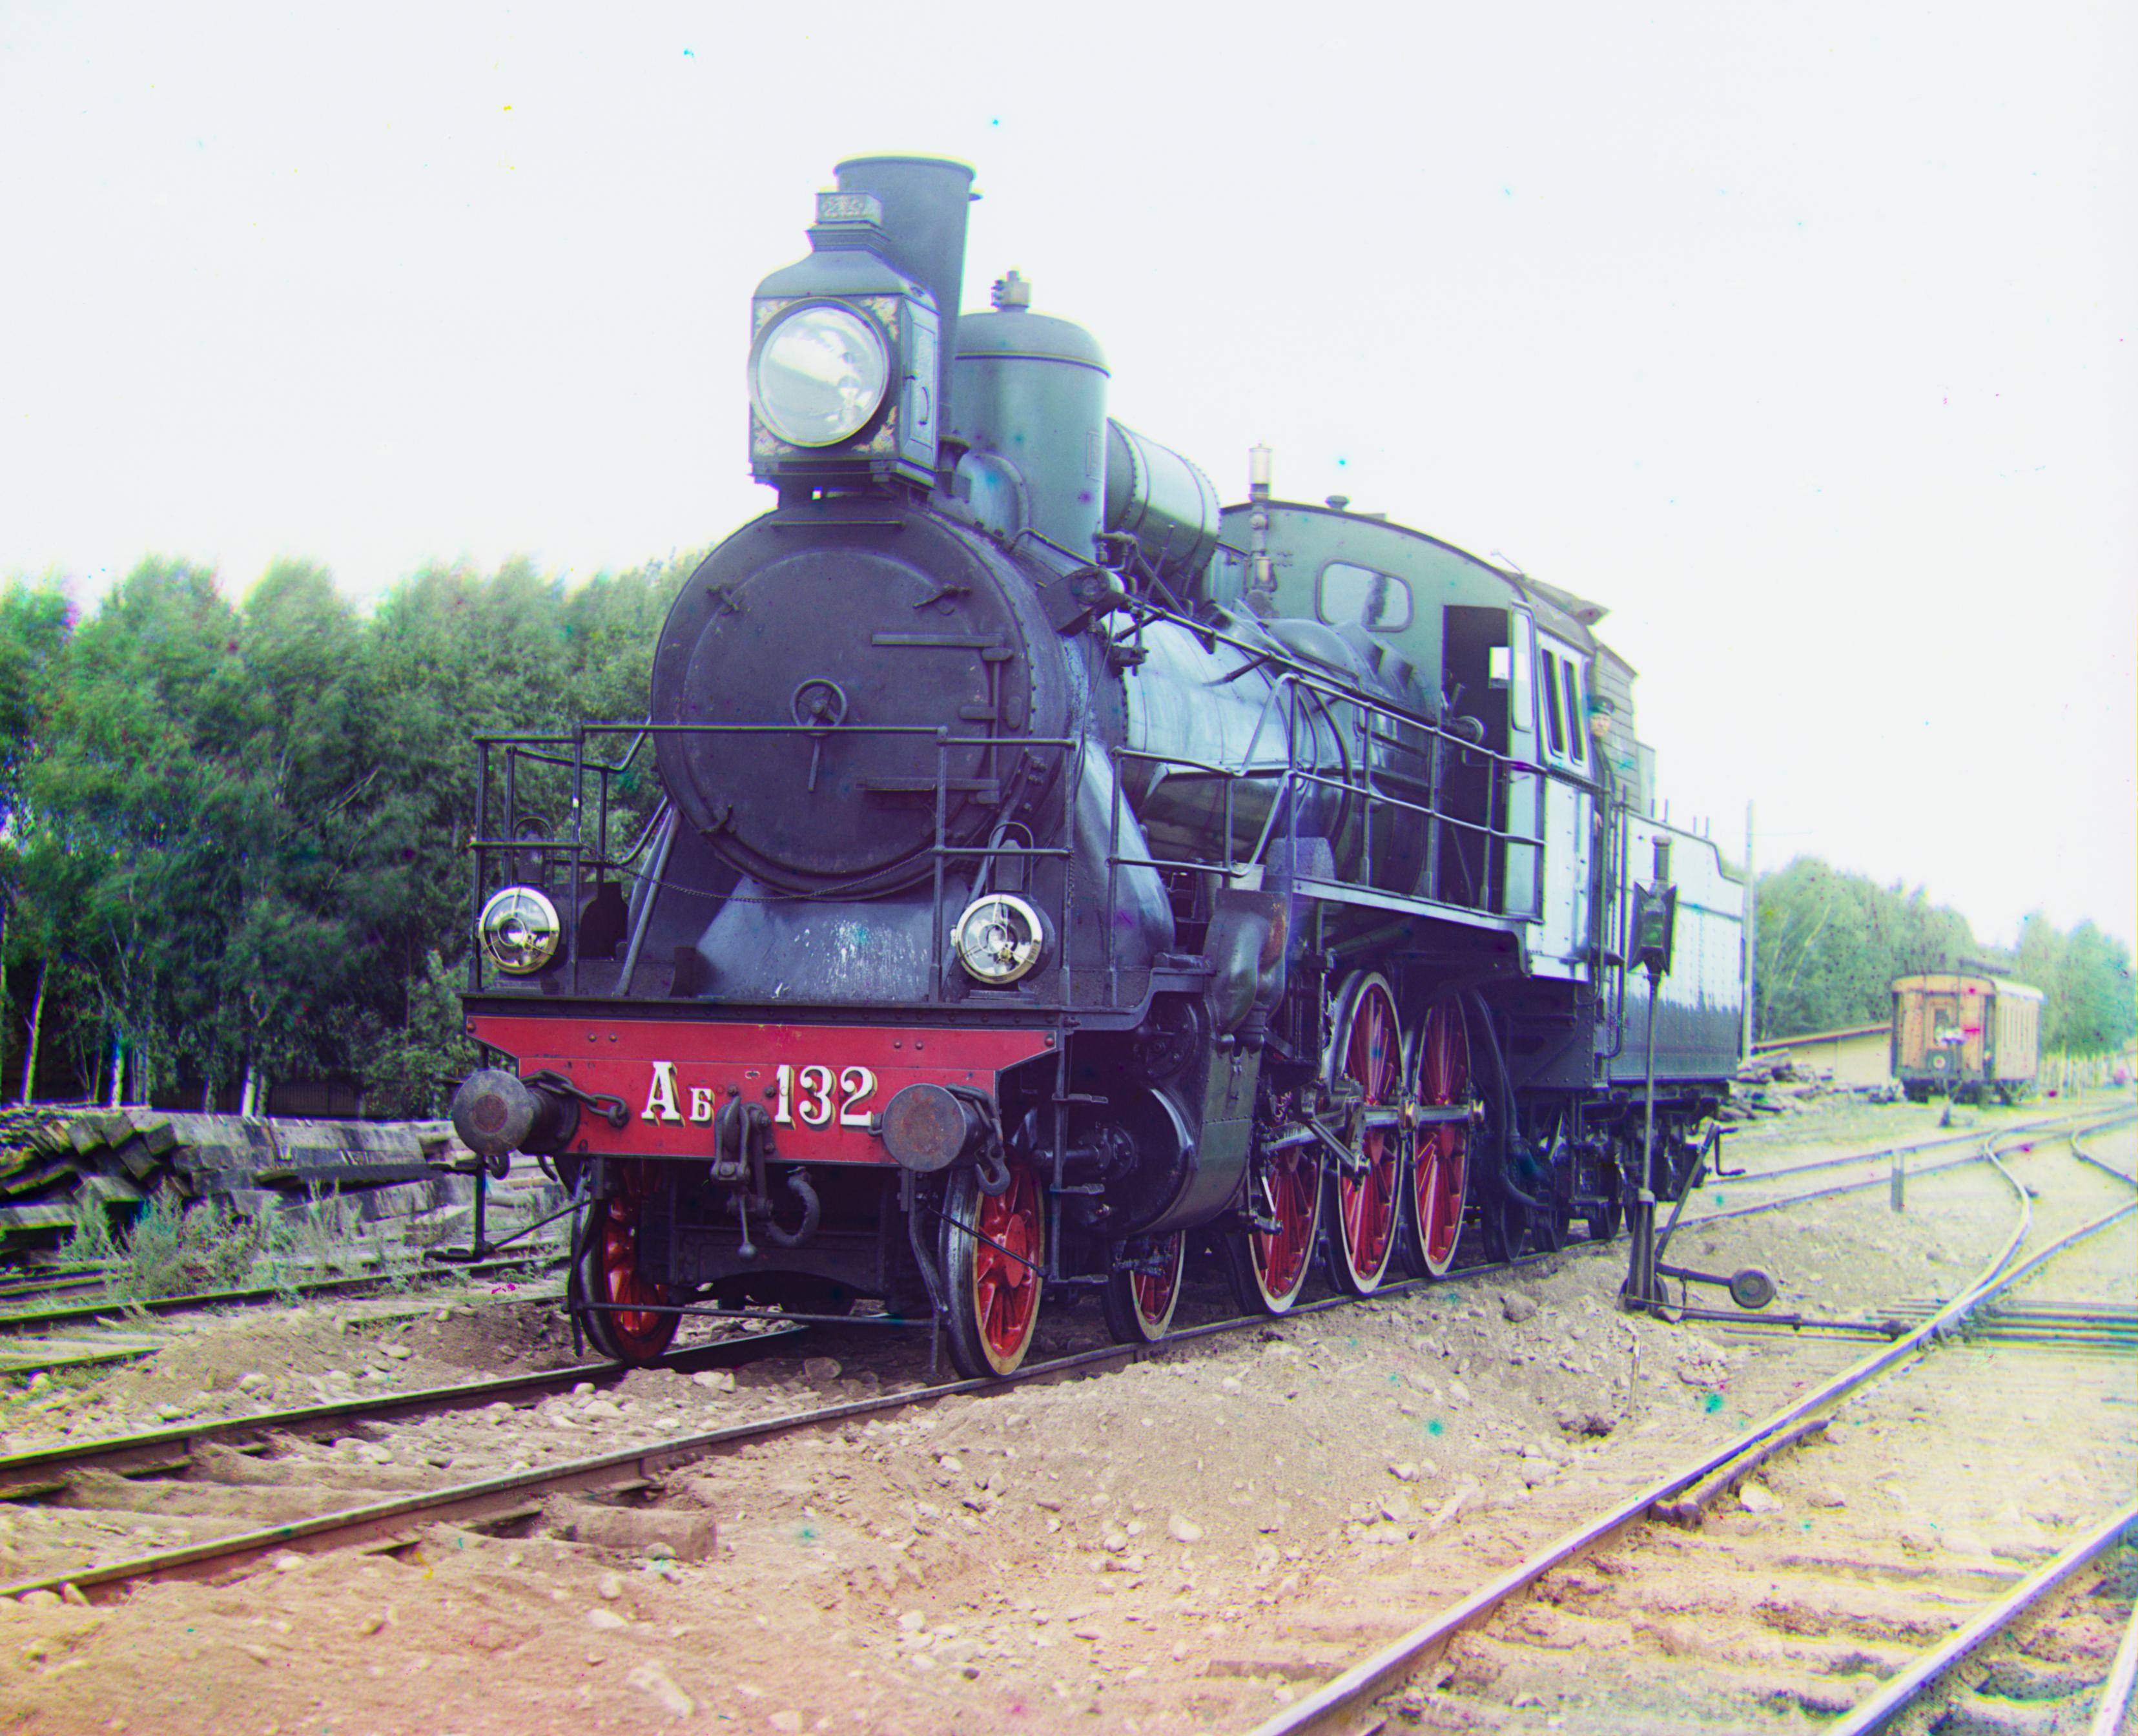
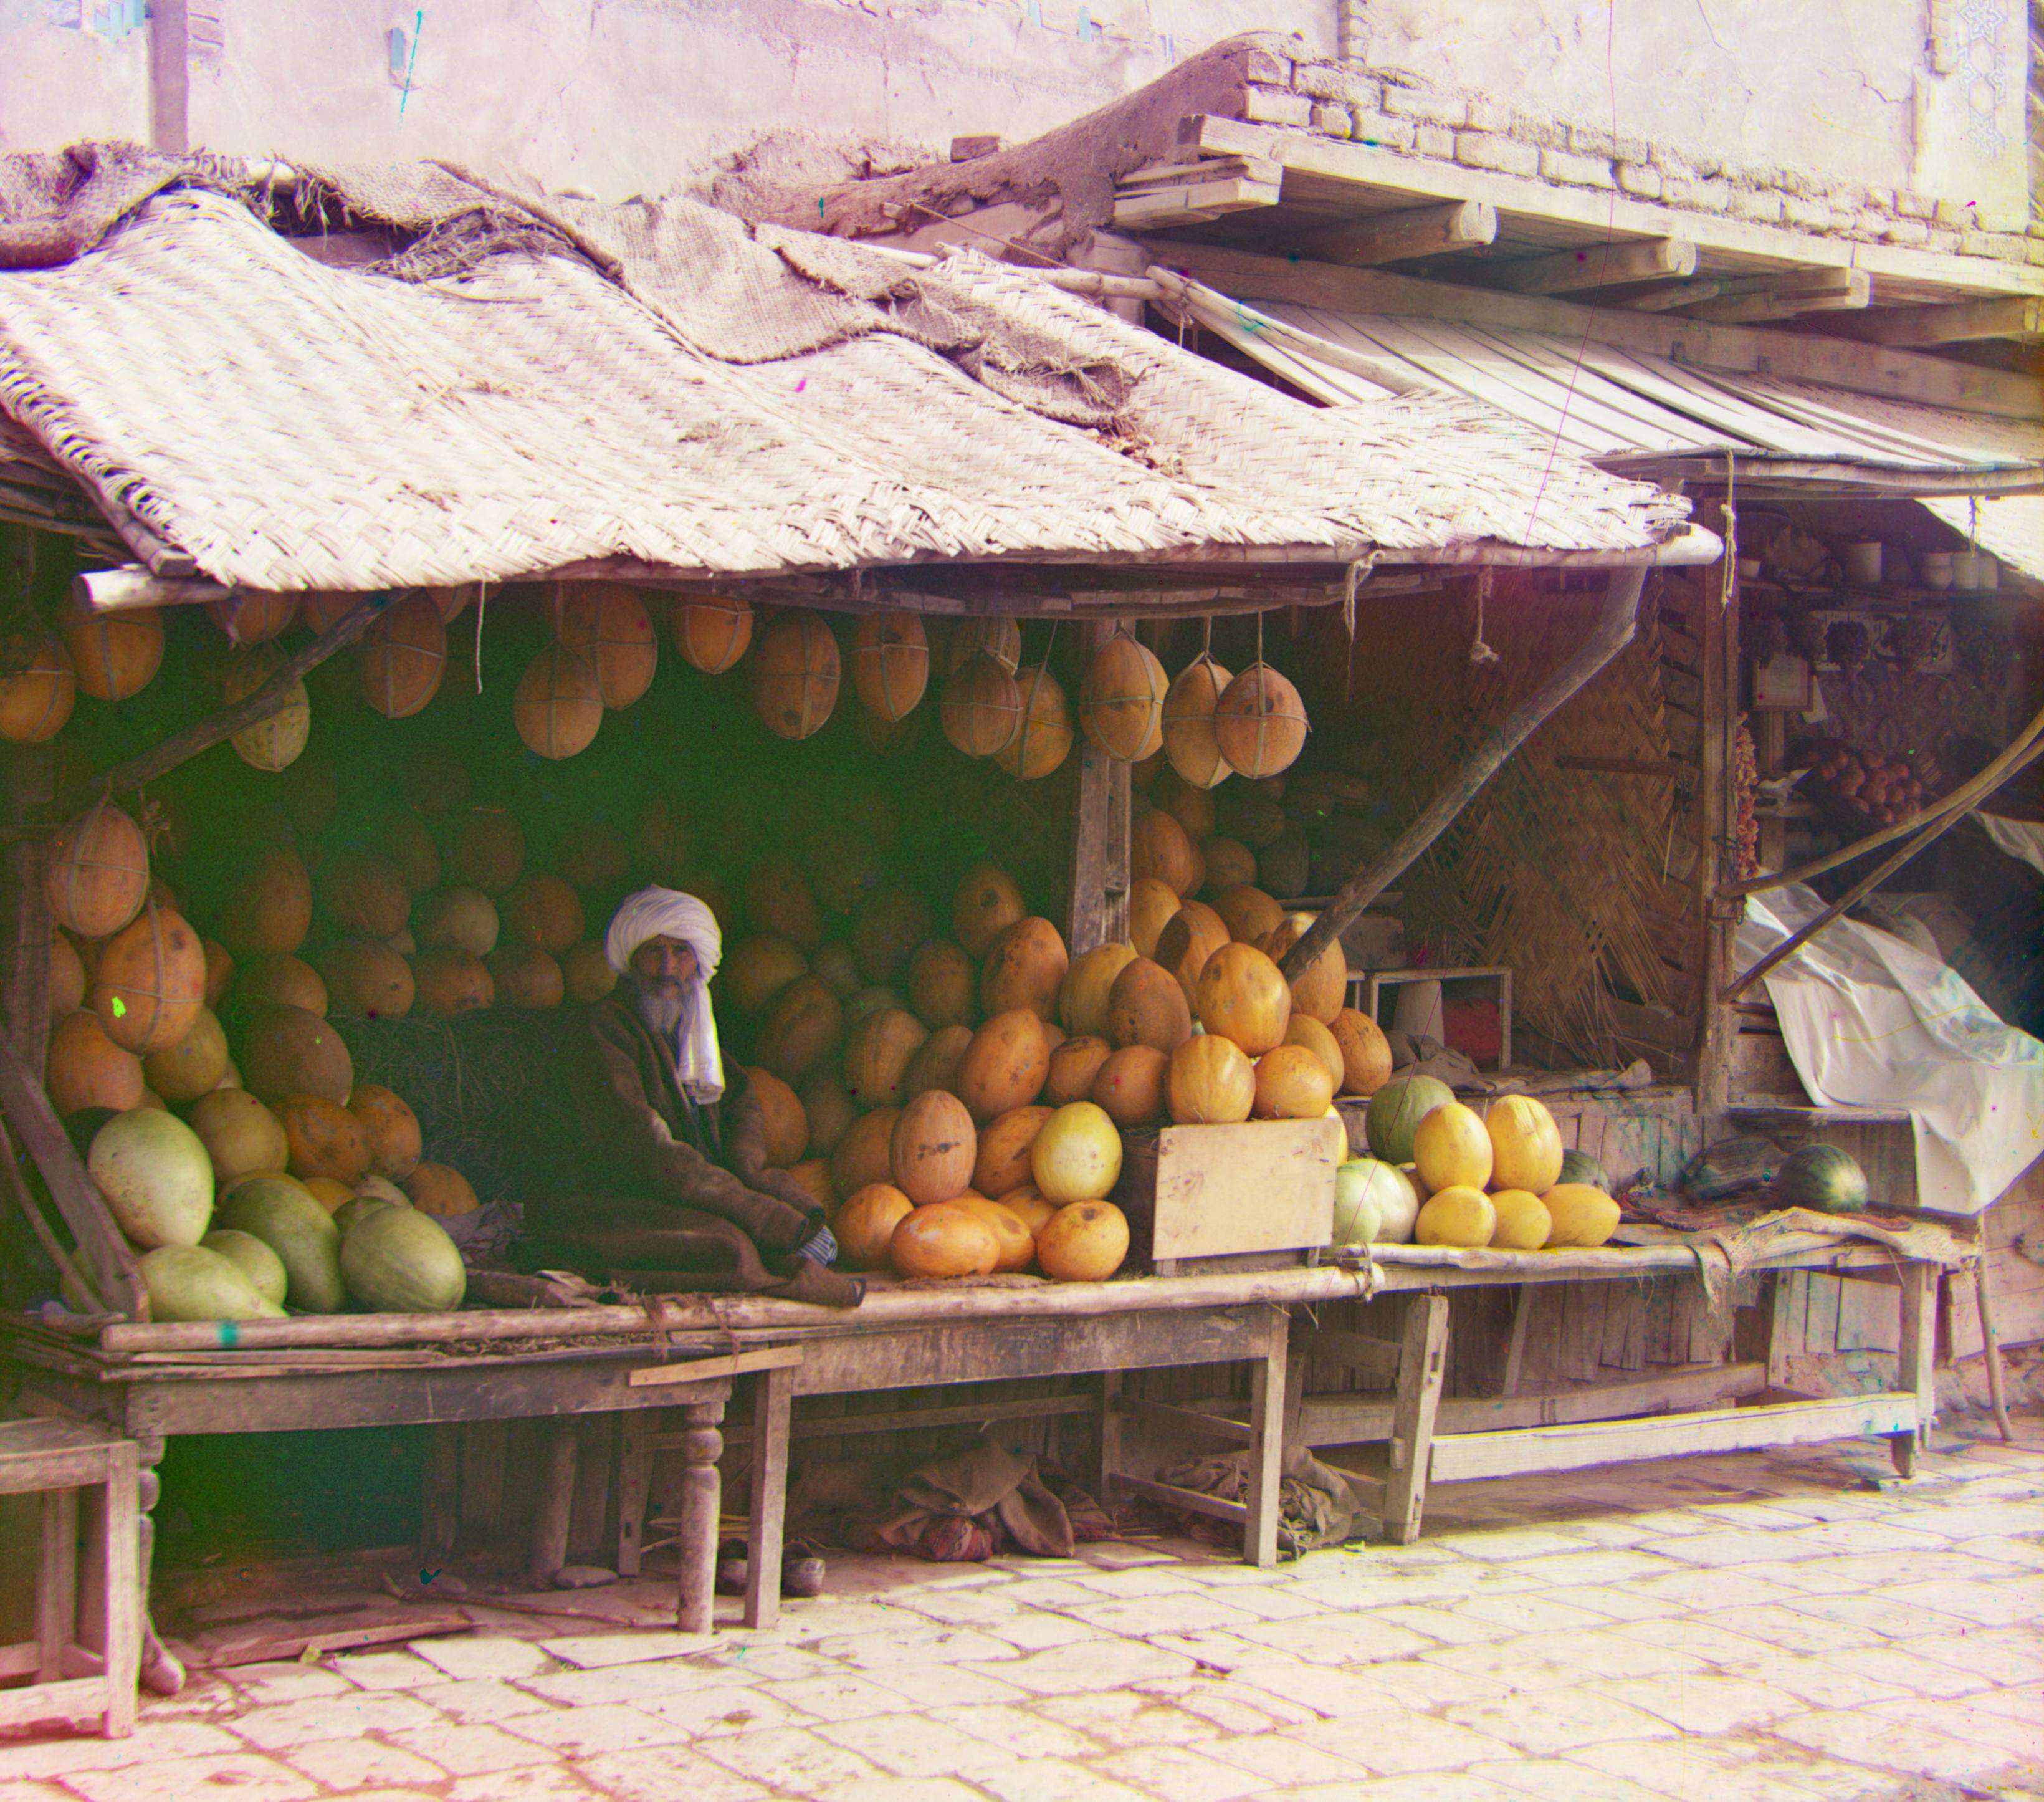
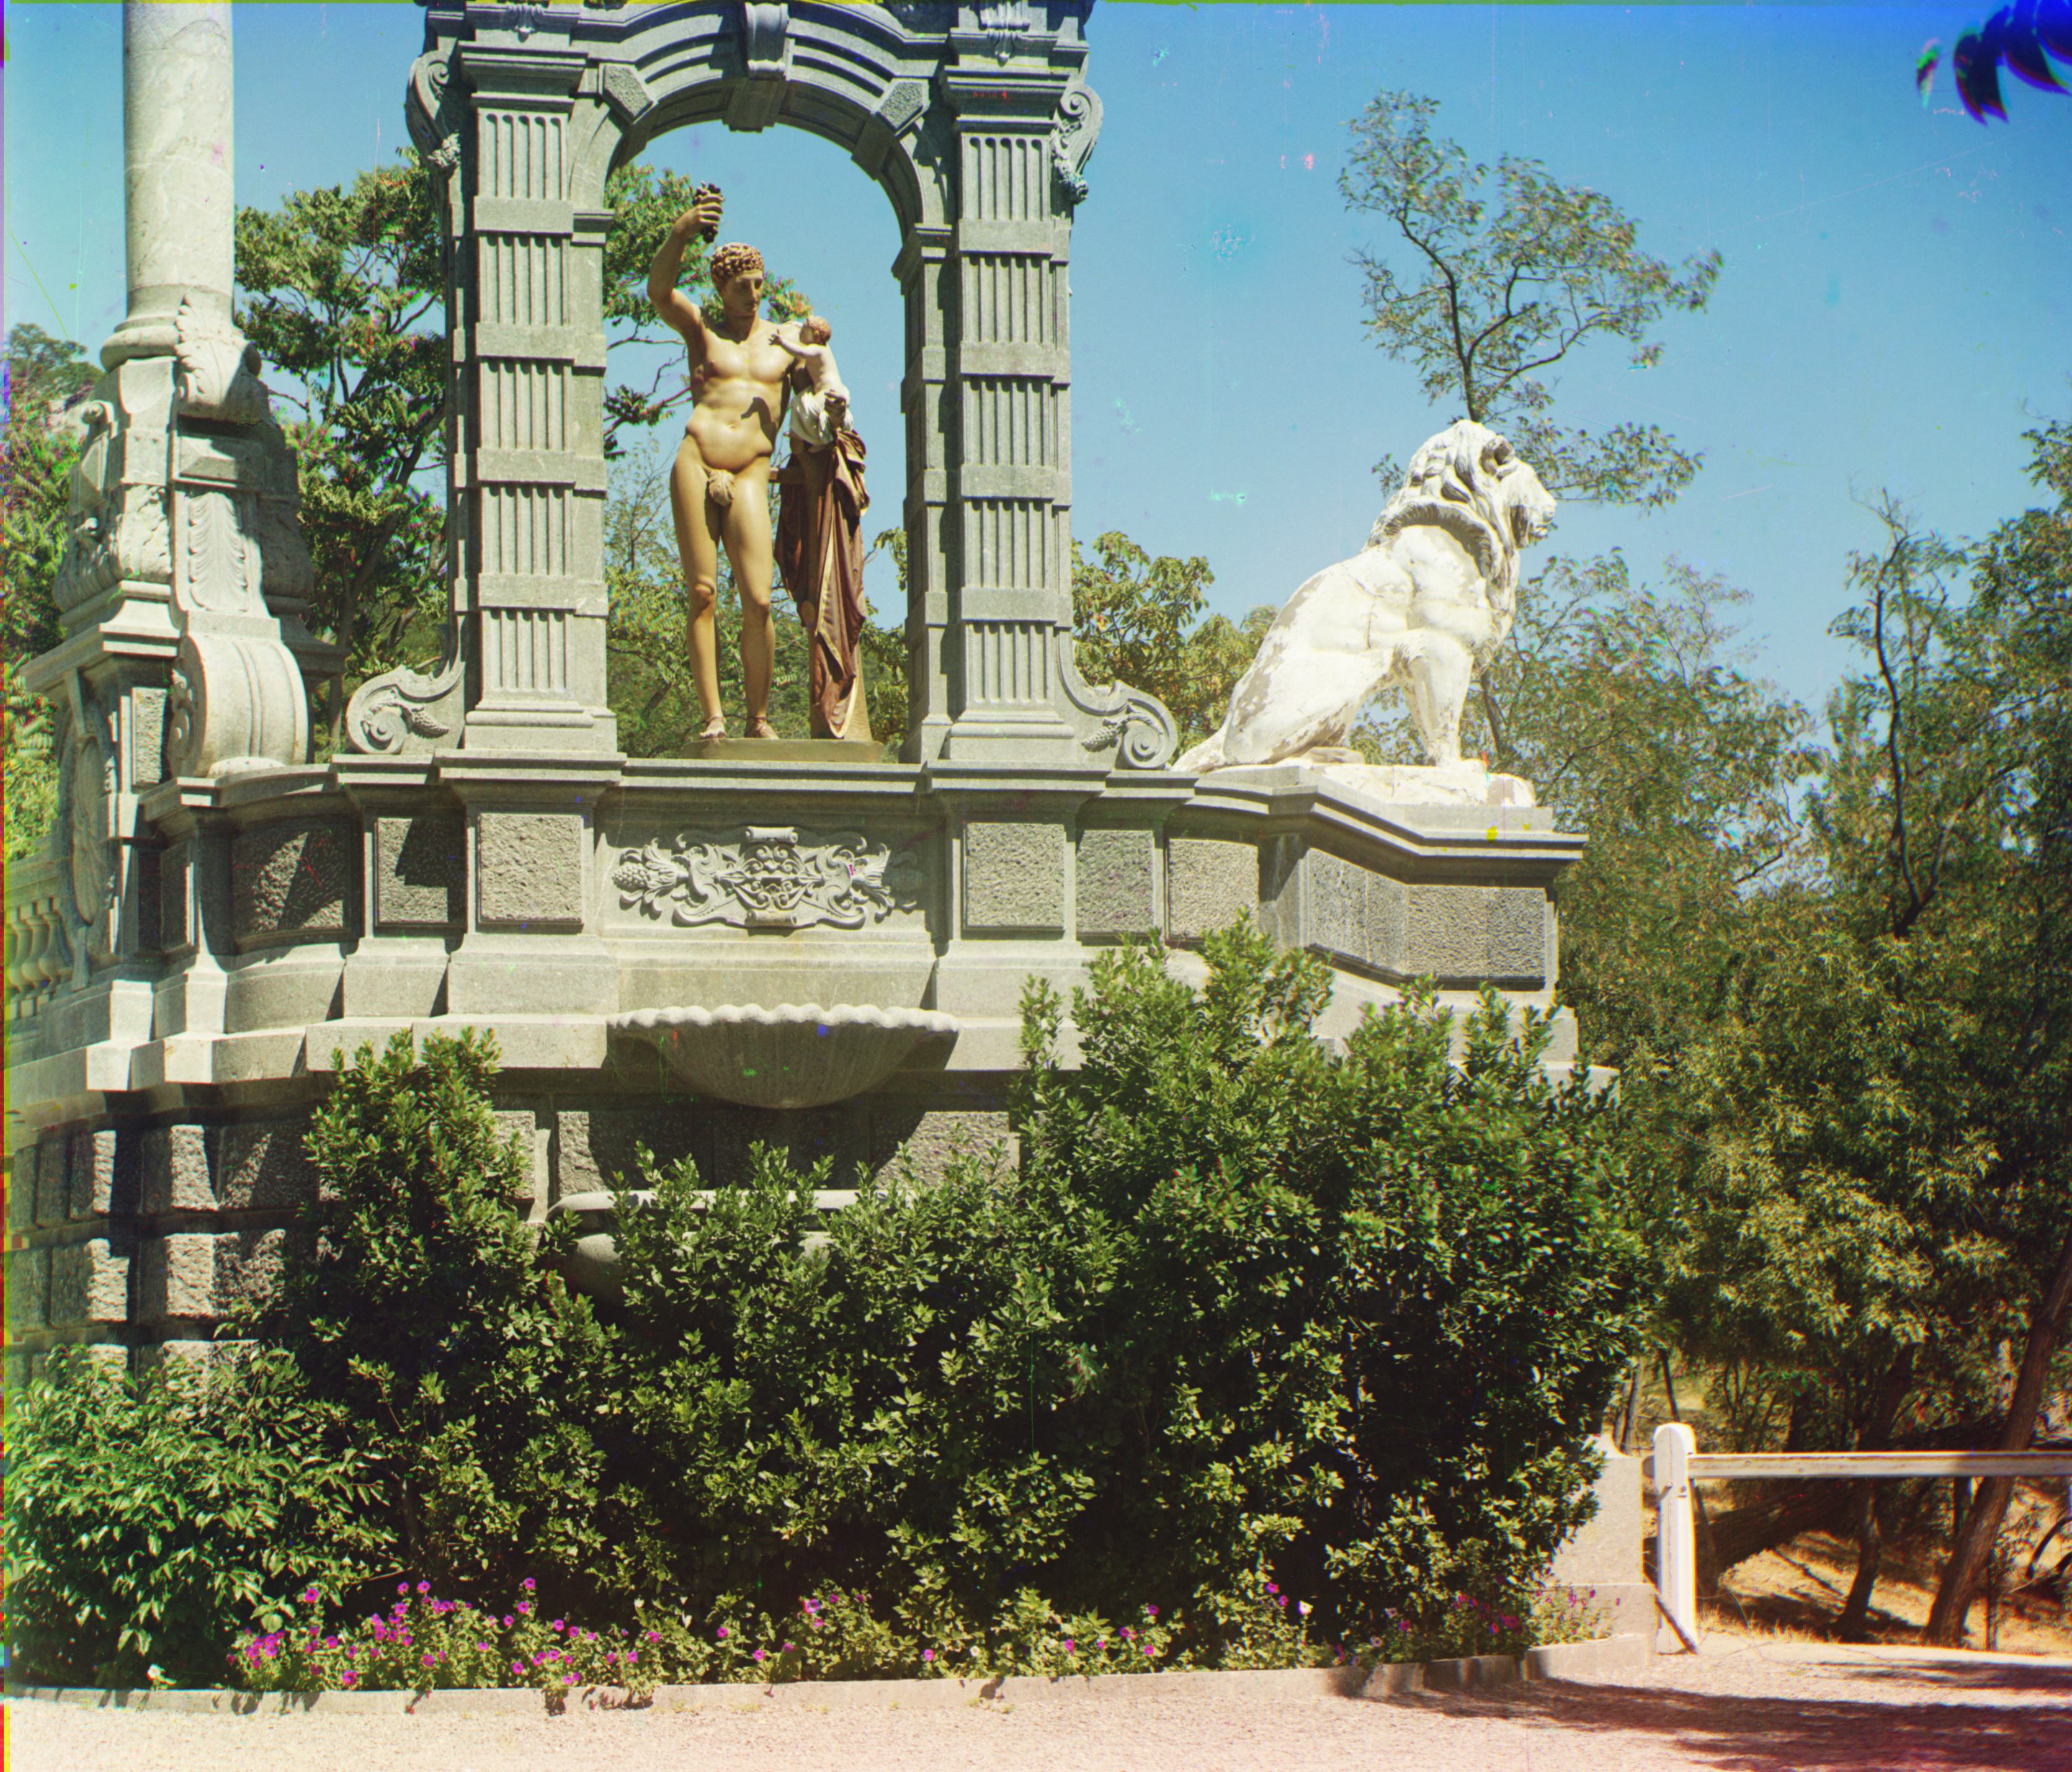
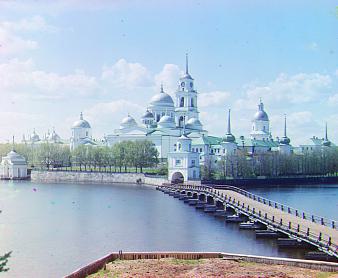
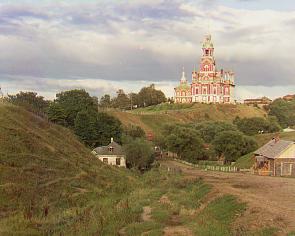
I tried several forms of edge detection, which noticeably improved image quality for some images. For edge detection, I used both a Sobel filter and a Canny filter to detect edges. A Sobel filter works by combining vertical and horizontal derivatives to find the overall magnitude of the derivative in each pixel of the image. These derivatives calculate how the image intensity values are changing at each pixel, allowing edges to be located. These edges provide superior information to match the image channels. I used the Sobel filter function from sk image, and then ran the identical image alignment process using the Sobel filtered image instead of the raw pixels.
I also tried a Canny filter, which is a refinement of the Sobel filter that isolates the edges with the most change to remove noise. However, I did not find any images where the Canny filter outperformed the Sobel filter. Since the Canny filter is more computationally expensive, I decided to use Sobel filtering for edge detection in my final implementation.
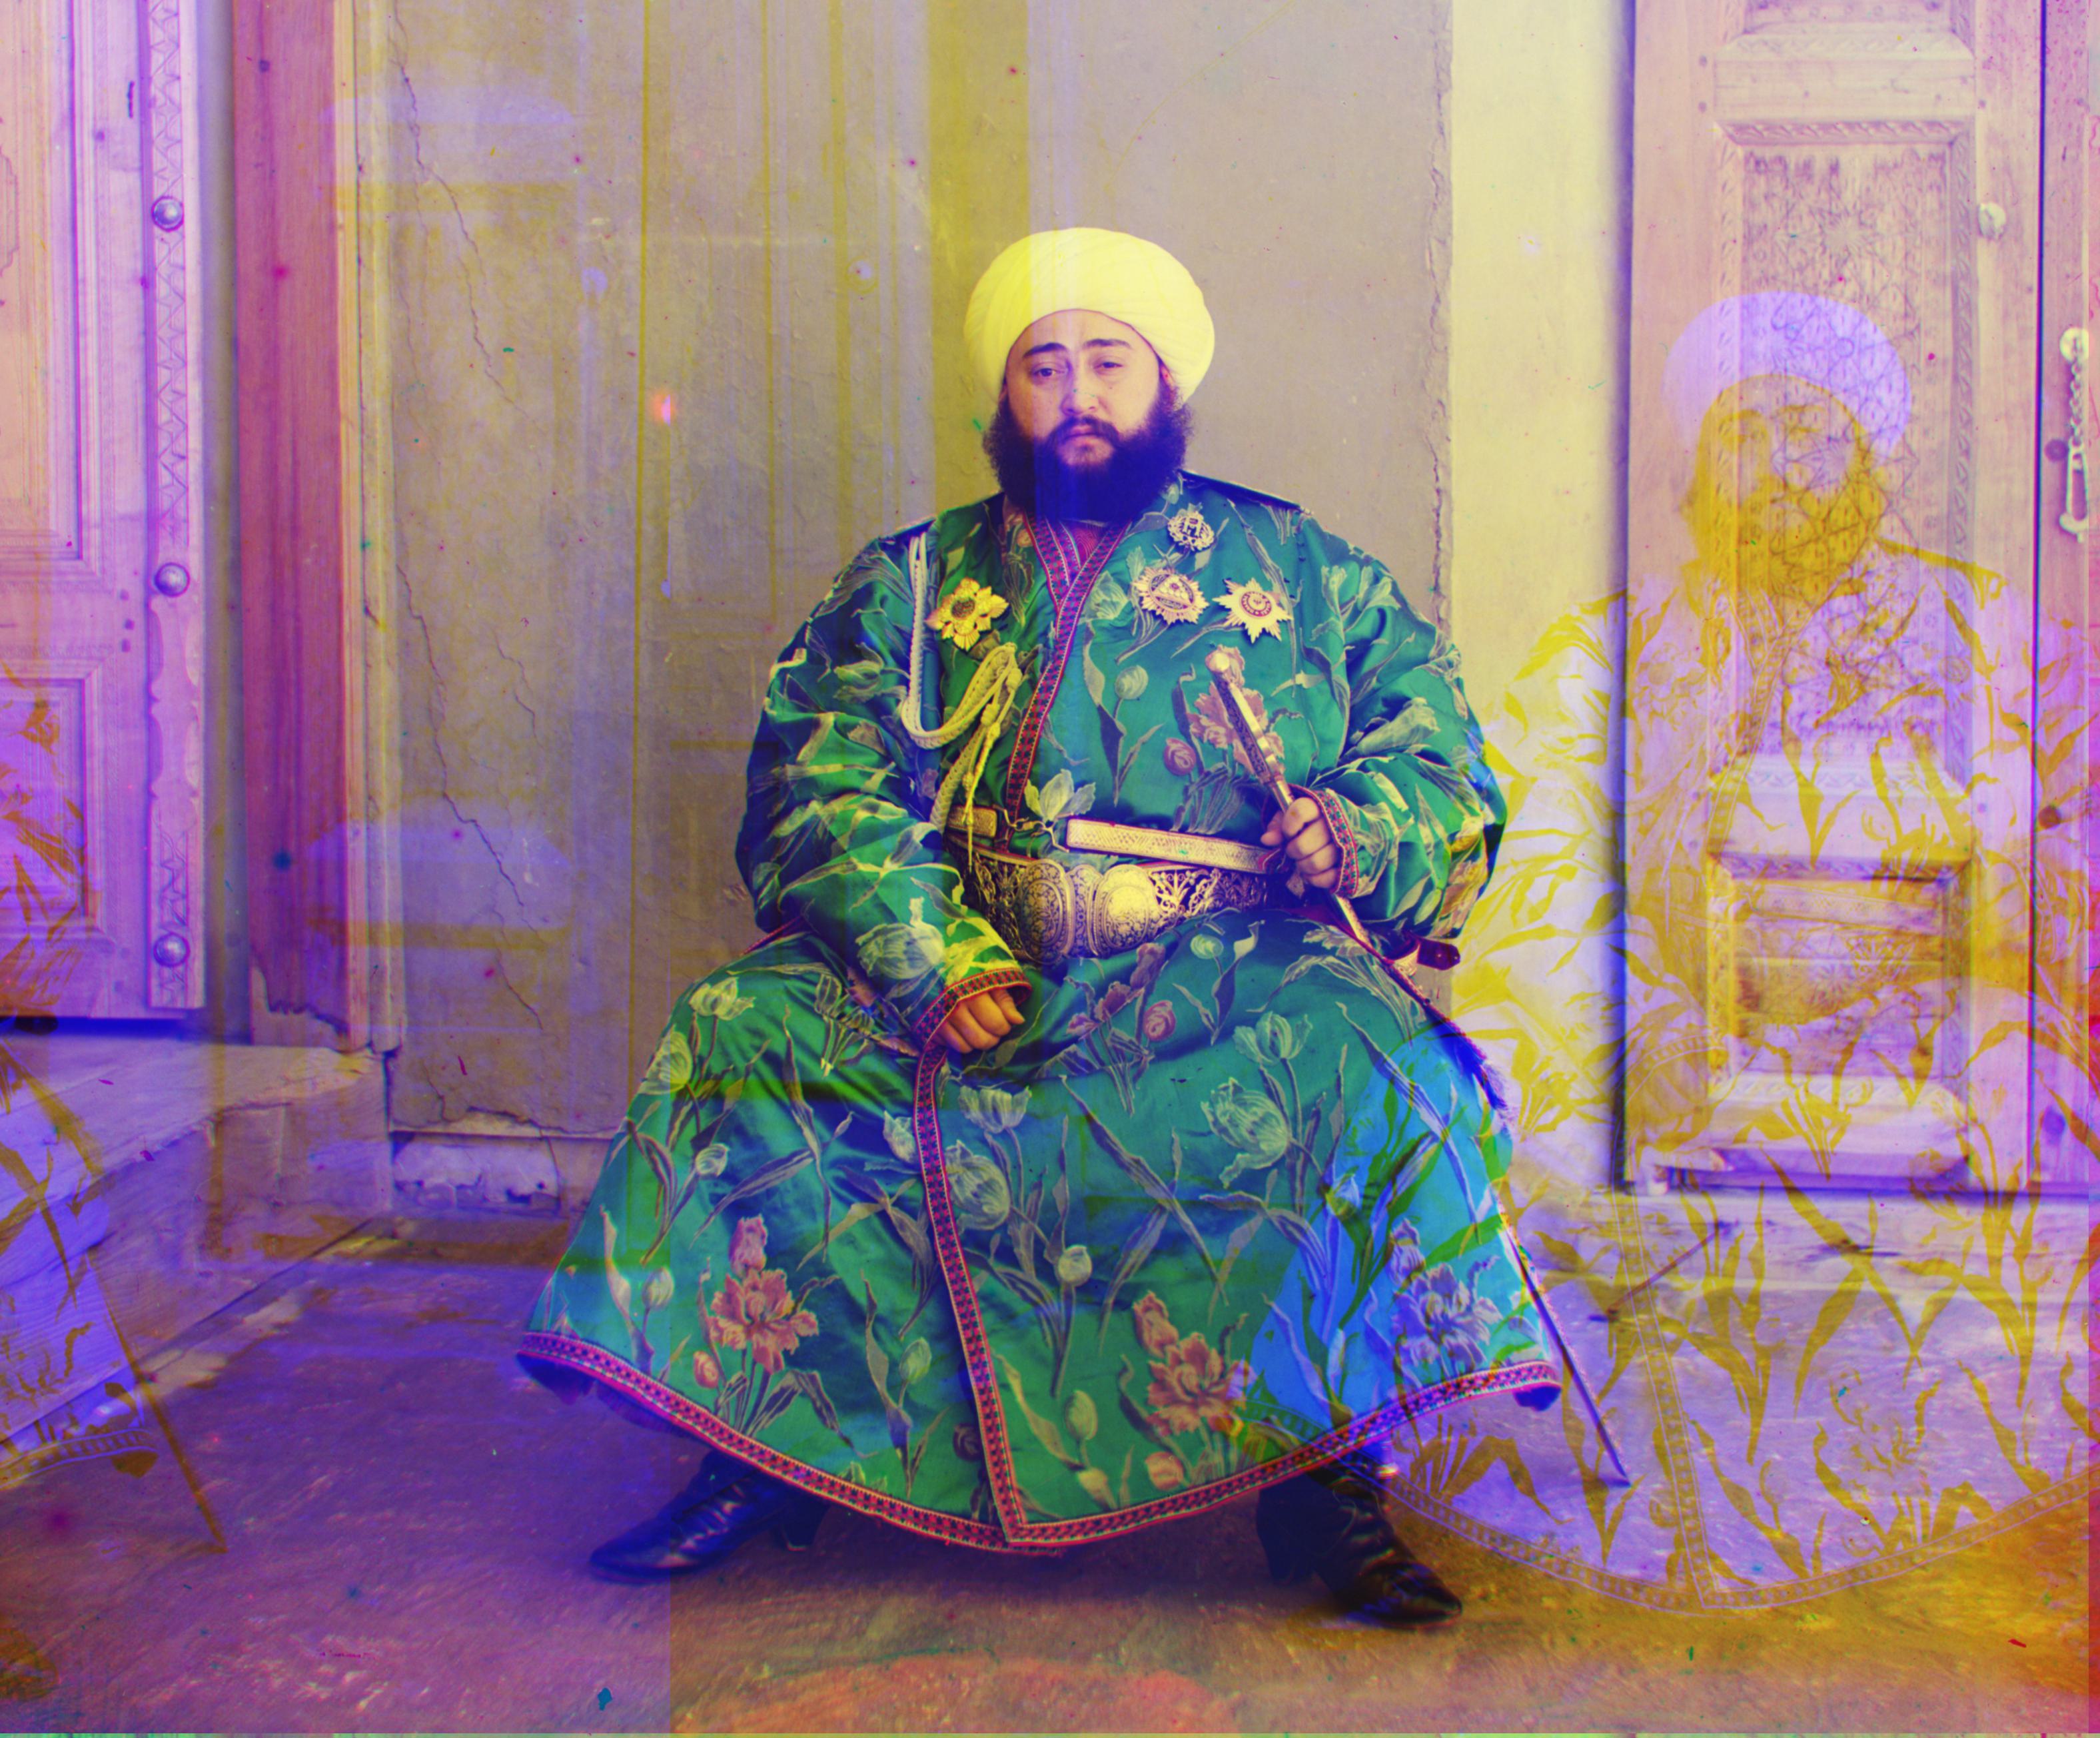
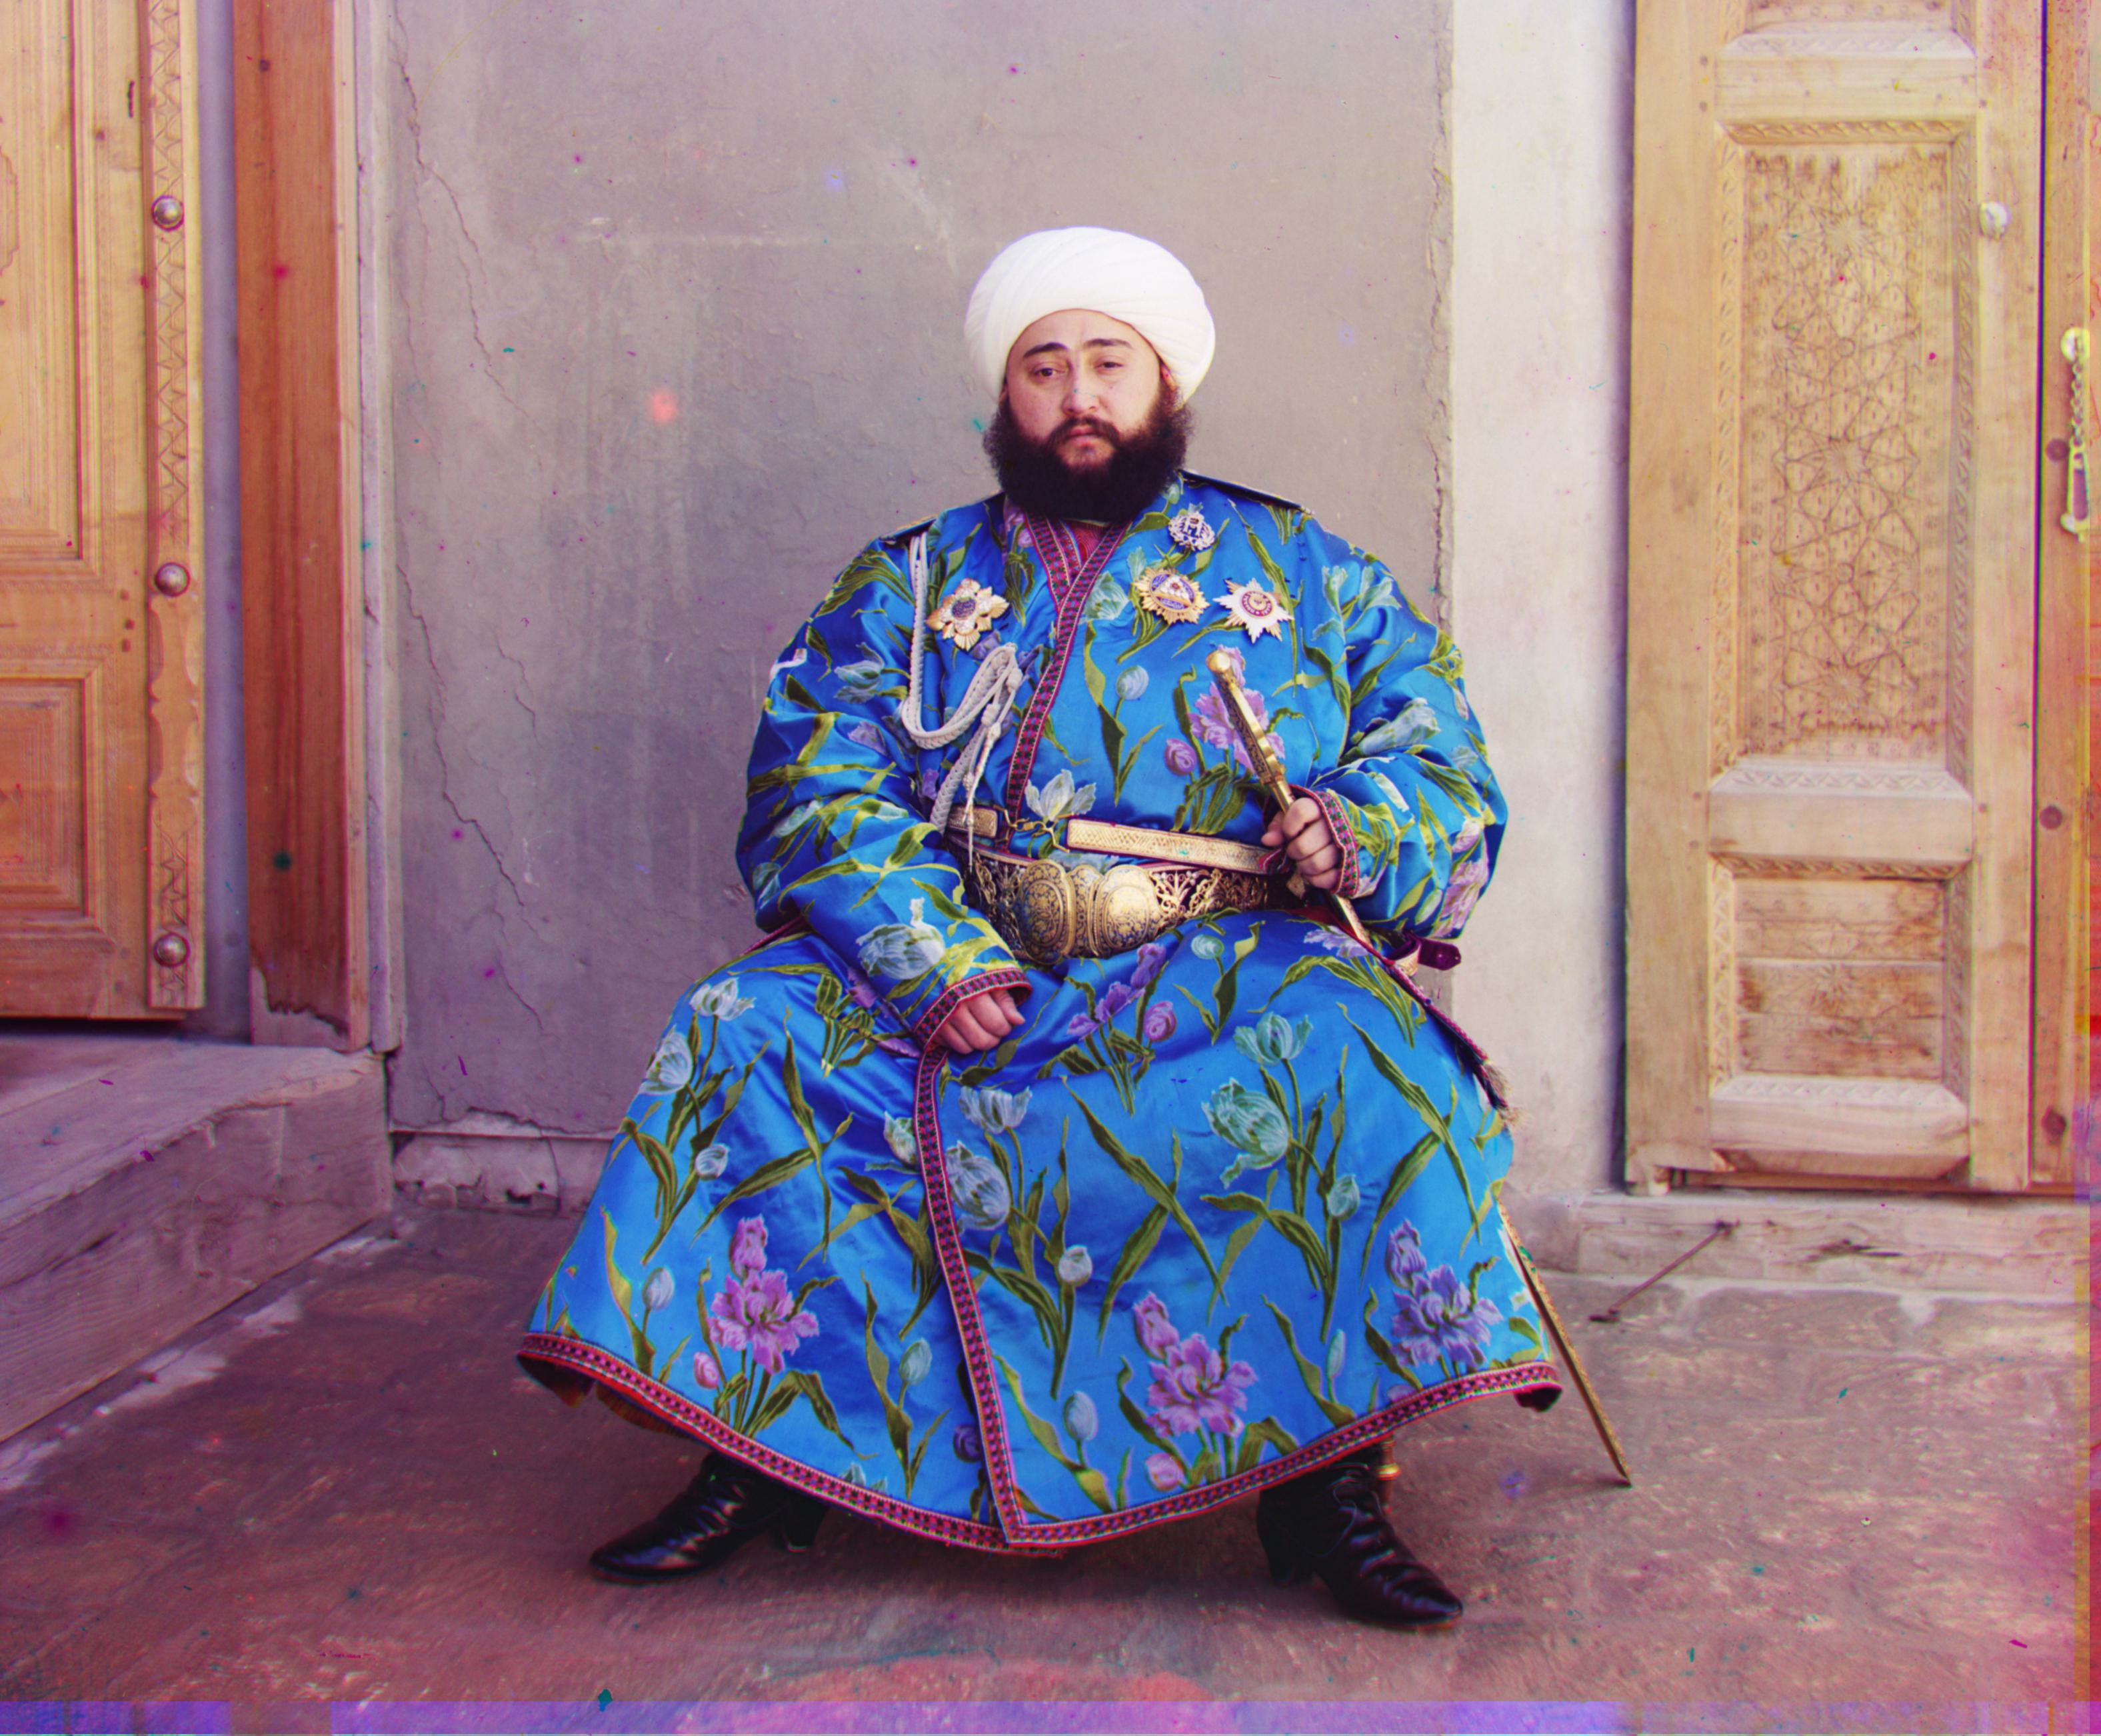
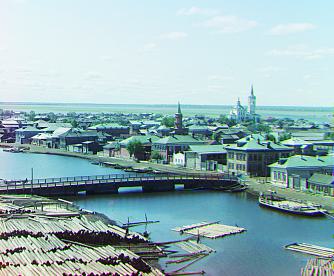
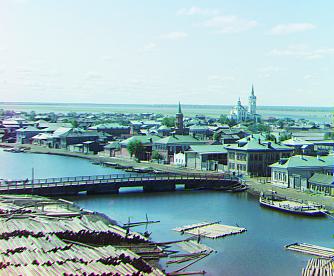
We can see the biggest improvement from Sobel Filtering in the Emir image. We can see that the algorithm makes an
unreasonably large shift on the blue channel of the Non Sobel image. This results in a blue Emir existing on the right hand side of the image, which is terribly mis-aligned. On the Sobel-filtered version, Emir is aligned nicely and the image looks VERY NICE!
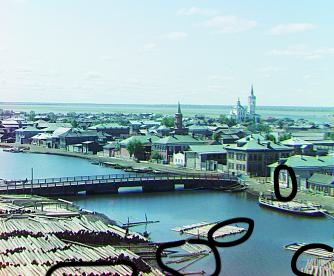
The tobolsk image also benefitted from the Sobel Filtering, albeit in a less extreme manner than Emir: In the non Sobel version, notice the green and red noise on the building on the center right of the image, as well as some color noise around the edges of the logs. This is evidence that the alignment is not quite perfert. Notice that these imperfection are absent on the Sobel filtered version, yielding a case where Sobel filtering supplied superior alignment and image quality. Since these differences are hard to notice on the small image, I have included below the images in a larger format where the alignment imperfections are circled.

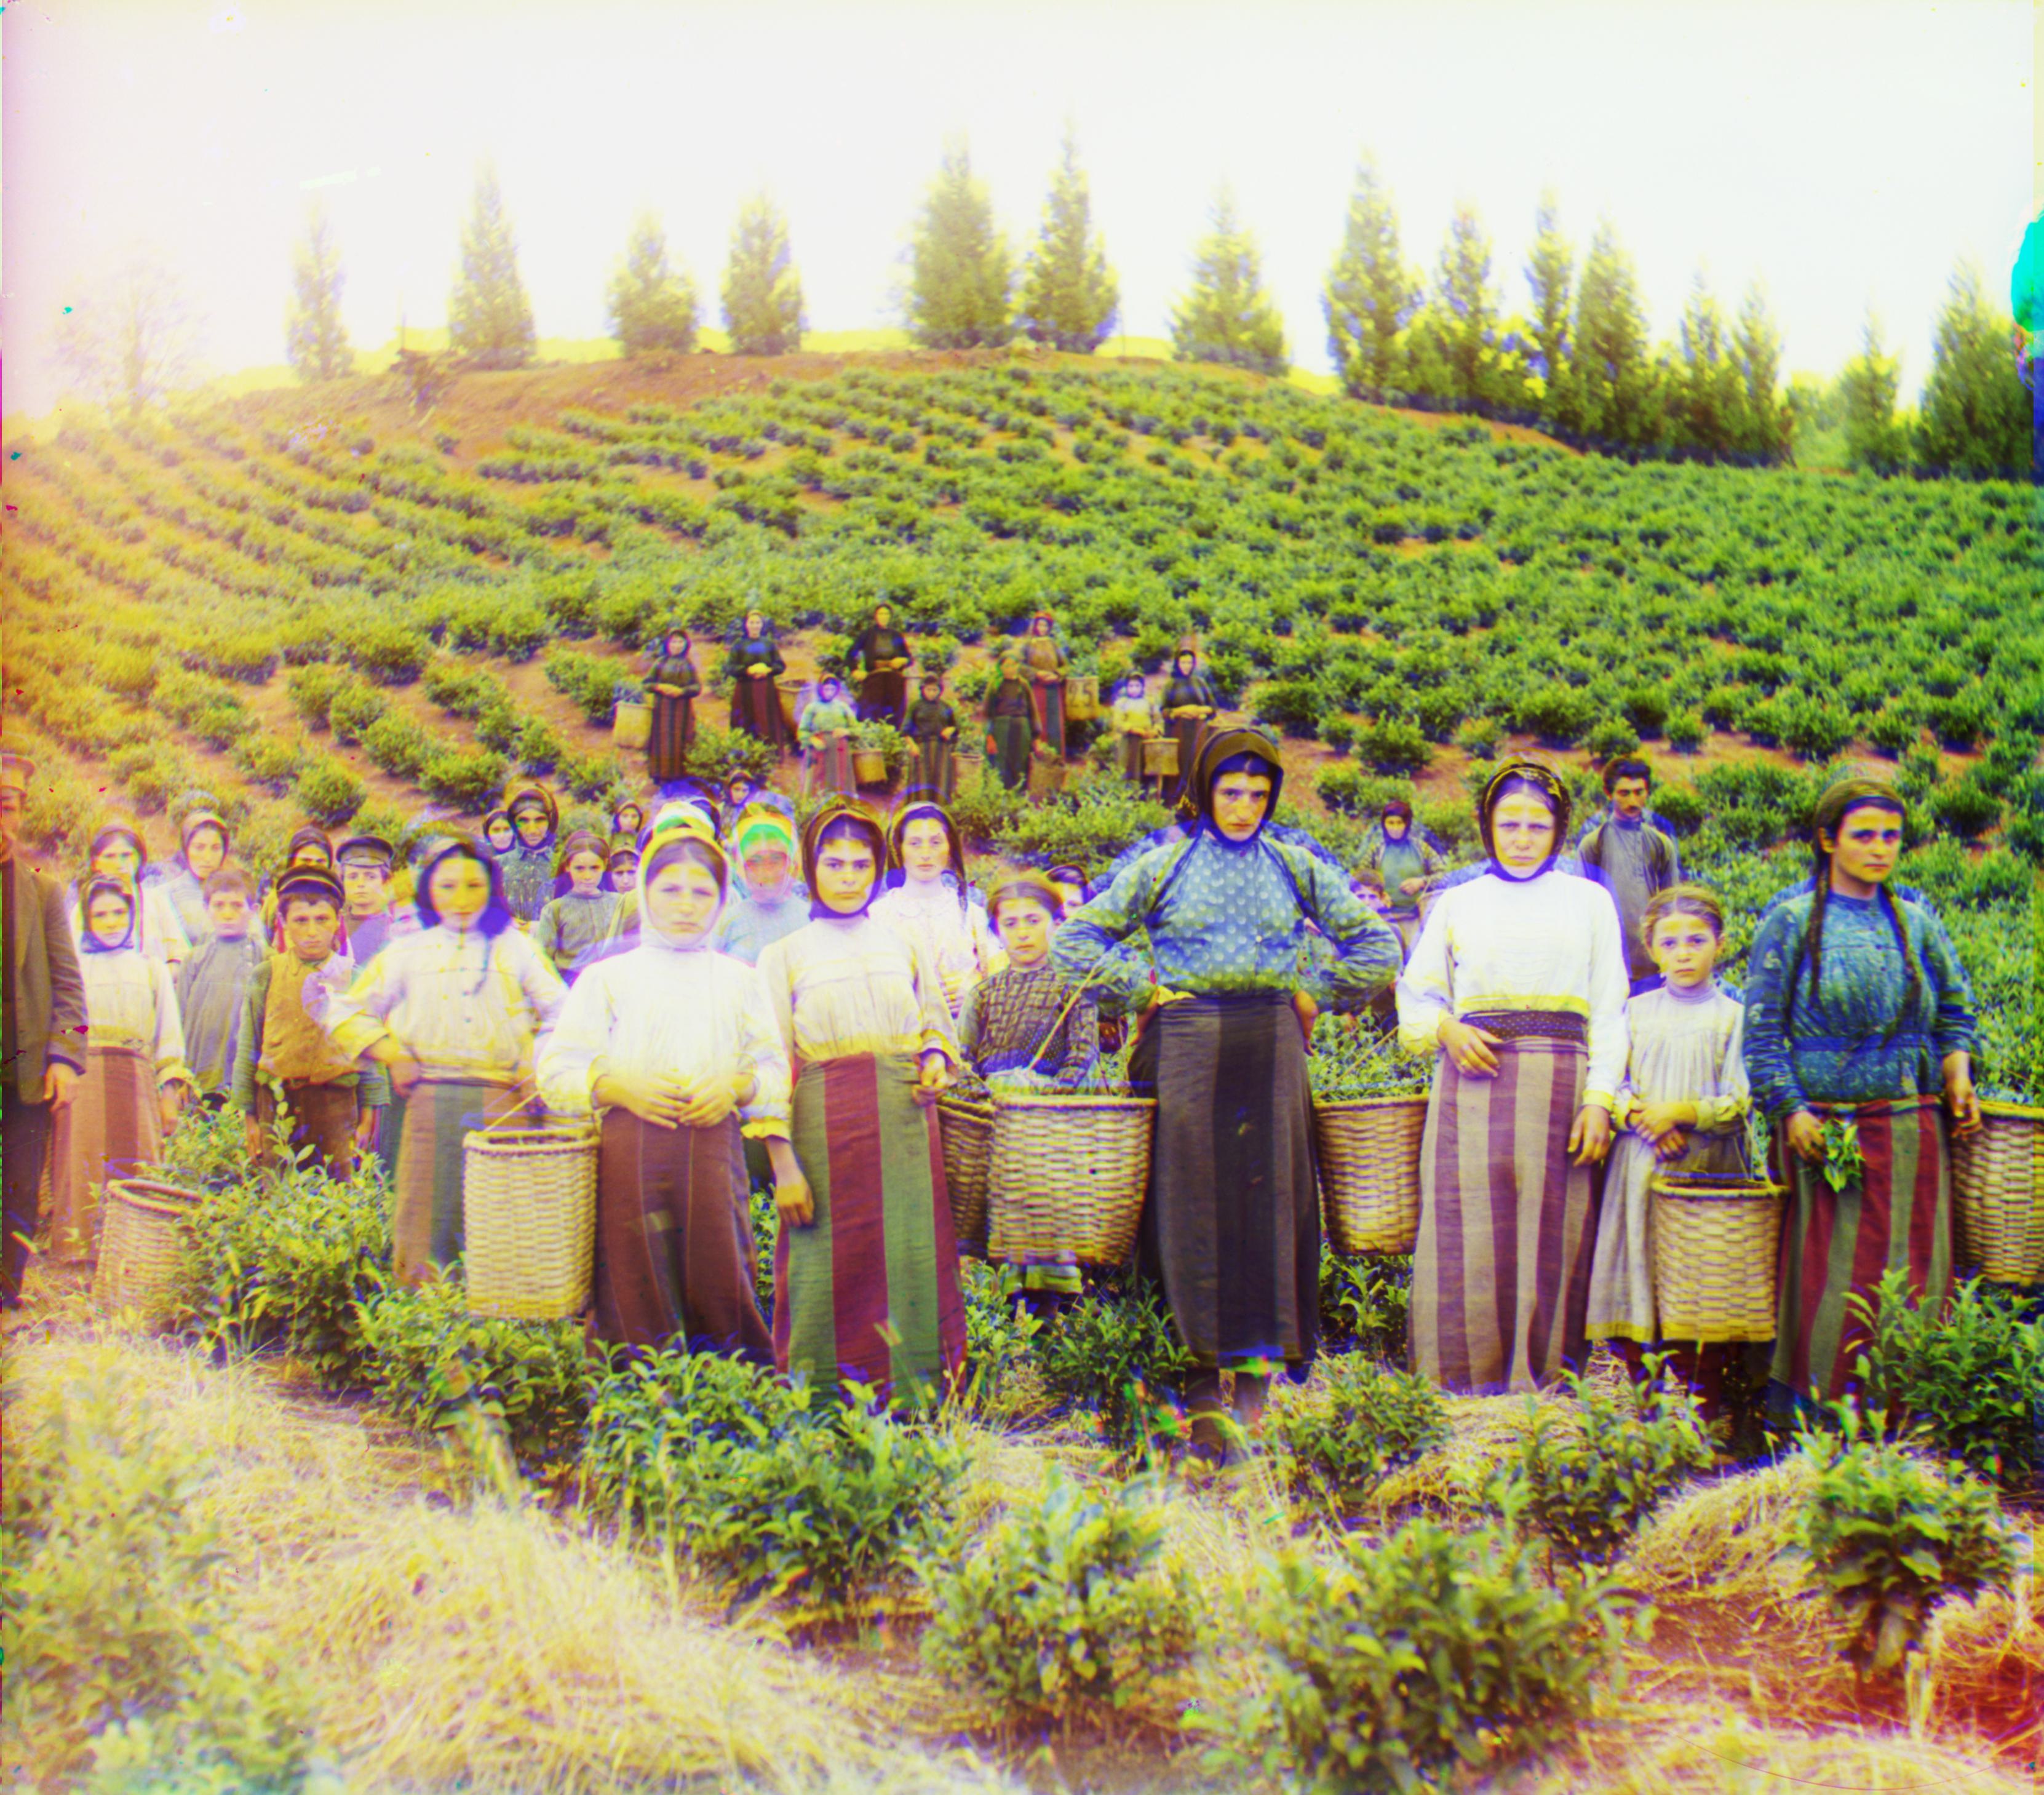
As you can see, this image has some odd artifacts; however, my algorithm worked well on the image and I believe that the artifacts are from the raw image itself. As we can see, the colors are aligned well on all channels and all edges looked matched. Thus, it appears that my aligning image has worked well. However, I feel the need to address why this image in particular looks poor since it is--to be frank--rather disturbing. Notice how the children in the middle are glowing and rather translucent. The worst case of this phenomenom appears around the child near the middle with the green blob surrounding the child's head. I believe that this is due to blurriness in the data itself, likely resulting from the image process of the day. As discussed in lecture, cameras in this era required long exposure times to capture images. I speculate that the children were unable to stay still during the image taking process, likely moving by small amounts. This caused their images to be blurred throughout the areas where they were moving, creating this transparent ghost-like effect. The bright white shirts people in that area of the image are wearing likely also saturated the image and lead to quality issues.
This is the same information that is in my README.txt file included here.
Instructions to recreate images:
I put in special effort to make it easy for readers to recreate my images by creating a clean python script to run and a pickled Pandas DF "metadata.pkl" containing the results of my program from when I aligned the images.
Backstory:
I worked in the main.ipynb to develop my algorithms and find what was effective. Understandably, this became messy with all of my experimentation. Thus, I created the Python script generate_images.py with just the algorithm components I decided to use to generate the images for the website. I also collected the channel shifts I used to align the images, as well as the amount of cropping I used to create the images on the website. Thus, the images on my website should be fully reproducible.
How to Use:
Place the generate_images.py file in a location such that the raw images are in a sub folder called "data" (eg such that to access the onion church, use "data/onion_church.tif") and a subfolder called "proc_images" for the program to save the processed images to.
To recreate my images , run the generate_images.py script. With the metadata.pkl file in the directory, the script will load in the pandas df that contains the data of how much I cropped each image and the program will automatically crop each image according to how much I did so when making the images. The program will ask you if you want it to recalculate how much to shift each image channel (in case you want to verify how the algorithm works) or if you want to use the same shift values I did that are included in the pickle (in case you want to save time). When recalculating the shift amounts, it takes about 50 seconds per image for the large images on my machine. Enter 1 to have my program recalculate the image shifts.
I consulted some external resoures when creating this website for instructions on how to write HTML and CSS code. Some of my webpage code is adapted from https://www.w3schools.com/howto/howto_css_images_side_by_side.asp and https://stackoverflow.com/questions/12912048/how-to-maintain-aspect-ratio-using-html-img-tag.
The first and last lines of the introduction paragraph are taken from the CS180 course website.
I would like to emphasize that all of the code for image processing is of my own creation.